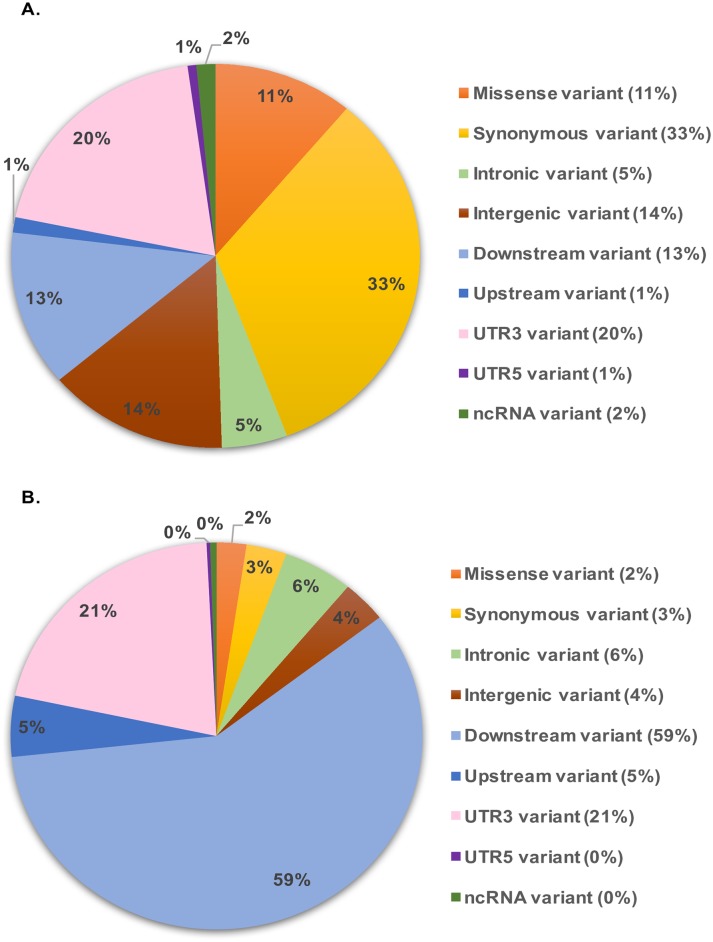
Fig 2. Pie charts depicting distribution and predicted consequences of SNVs in B-cell lymphomas versus controls panel.
A. Distribution of all SNVs (n = 11,350). B. Distribution and consequences of novel SNVs (n = 2,598). Upstream/downstream variant: variant overlaps 1-kb region upstream/downstream of transcription start/end site, respectively.

