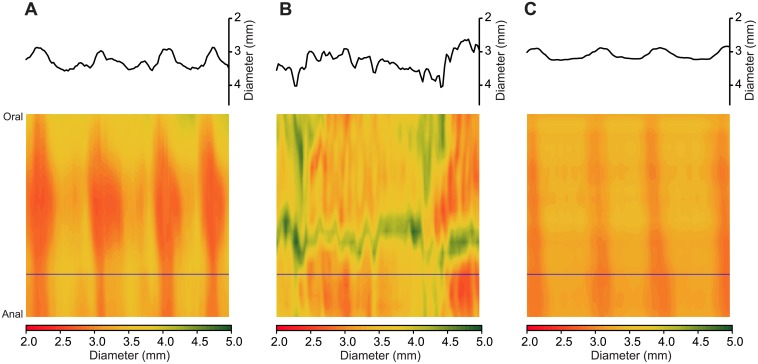
Fig 1. Spatiotemporal Dmaps showing effect of 2′FL on stressed jejunal segment in vitro.
Spatiotemporal diameter maps for which the top to bottom axis gives the oral-anal distance (4 cm) and time is represented from left to right (300 s). The gut diameter at each locus is scaled to a red-green heat map with red representing contraction and green relaxation. A diameter vs time plot for a single level along the oral-anal axis (indicated by horizontal line) is inserted above each spatiotemporal map. A) Unstressed jejunum. B) Jejunum taken from previously restraint-stressed animal showing reduction in coordinated oral to anal PCCs. C) Diameter map made from the same ex vivo segment as for B but starting 5 min after 2′FL was added to the lumen showing increased occurrence of regular coordinated PCCs.

