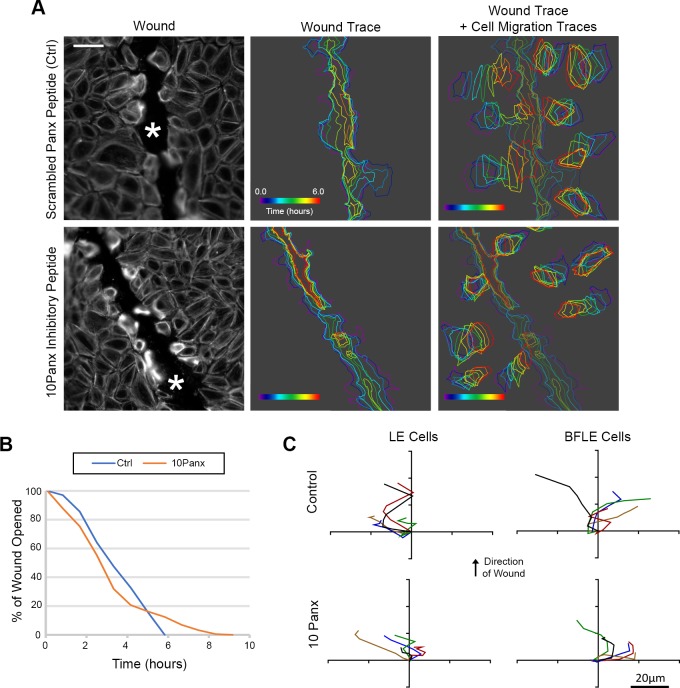
Fig 8. Inhibition of pannexin channels affect cell migration and wound healing.
(A) Live-cell imaging of the wound edge of cells preincubated with SiR-Actin Spirochrome (in grayscale) to determine cell migration over a 16 hour period. Scale bar = 66 μm. Traces of the wound area and 8 random cells in the field were drawn over time to observe the rate of cell migration and wound closure for the experimental and control conditions. Colors reflect time and are indicated by time wedge (n = 3). (B) Representative percent wound closure graph of cells preincubated with 10Panx or Panx scrambled peptide control over time (n = 3). (C) Representative cell migration trajectory diagrams of LE and BFLE cells preincubated in either 10Panx or Panx scrambled peptide control. Each line represents the migration path of a single cell plotted from a common origin. Scale bar = 20 μm.

