
6.
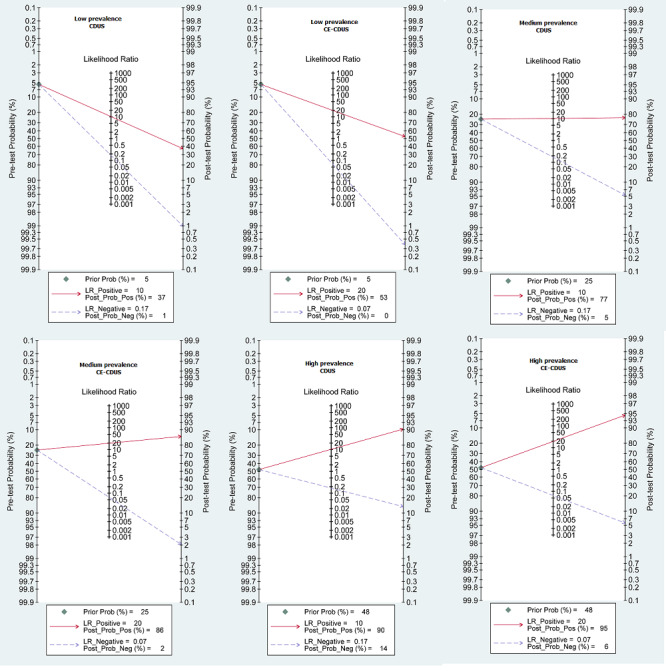
Fagan plot estimating changes in the probability that a person has an endoleak given a pre‐test probability: a presumed pre‐test probability at low (5.4%), median (24.5%) and high (47.6%) prevalence of endoleak for CDUS and CE‐CDUS. Left vertical axis represents the pre‐test probability, axis in the middle represents the likelihood ratio, and right vertical axis represents the post‐test probability (LR‐: negative likelihood ratio; LR+: positive likelihood ratio).