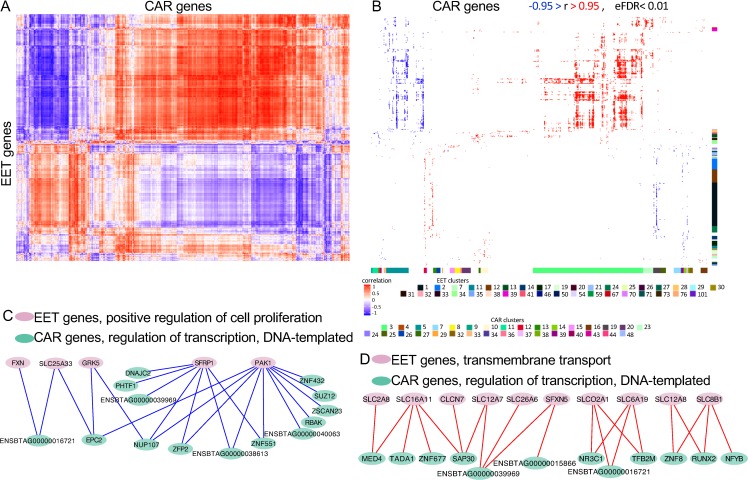
Fig 3. Analysis of coexpressed genes between EET and CAR tissues.
(A) Heatmap produced by the correlation coefficients and independent clustering of EET and CAR tissues. (B) Gene ontology analysis of the cluster formed. Only significant coefficients of correlation are shown (|r| > 0.95, eFDR < 0.01). The colored bar on the right of the heatmap indicates clusters of genes expressed in EET for which biological processes were significant. The colored bar on bottom of the heatmap indicates clusters of genes expressed in caruncle for which biological processes were significant. The colored squares at the bottom of the image identify the cluster number with the color observed on the bars. See S1 and S2 Datas for details on the cluster identification, biological processes, and genes. (C, D) Model of gene coexpression networks possibly formed between EET and CAR tissues. The data underlying each panel on Fig 3 can be obtained with the scripts presented in S1 Code. CAR, caruncular; CLCN, chloride voltage-gated channels; DNAJC2, DnaJ homolog subfamily C member 2; EET, extraembryonic tissue; eFDR, empirical false discovery rate; EPC2, enhancer of polycomb homolog 2; FXN, frataxin; GRK5, G-protein–coupled receptor kinase 5; MED4, mediator complex subunit 4; NFYB, nuclear transcription factor Y subunit beta; NR3C1, nuclear receptor subfamily 3 group C member 1; NUP107, nucleoporin 107; PAK1, serine/threonine-protein kinase PAK 1; PHTF1, putative homeodomain transcription factor 1; RBAK, RB-associated KRAB zinc finger: RUNX2, runt-related transcription factor 2; SAP30, Sin3A-associated protein 30; SFRP1, secreted frizzled related protein 1; SFXN5, sideroflexin 5; SLC, solute carrier; SLCO2A1, solute carrier organic anion transporter family member 2A1; SUZ12, SUZ12 polycomb repressive complex 2 subunit; TADA1, transcriptional adaptor 1; TFB2M, transcription factor B2, mitochondrial; ZFP2, ZFP2 zinc finger protein; ZNF, zinc finger; ZSCAN23, zinc finger and SCAN domain containing 23.

