
FIG. 3.
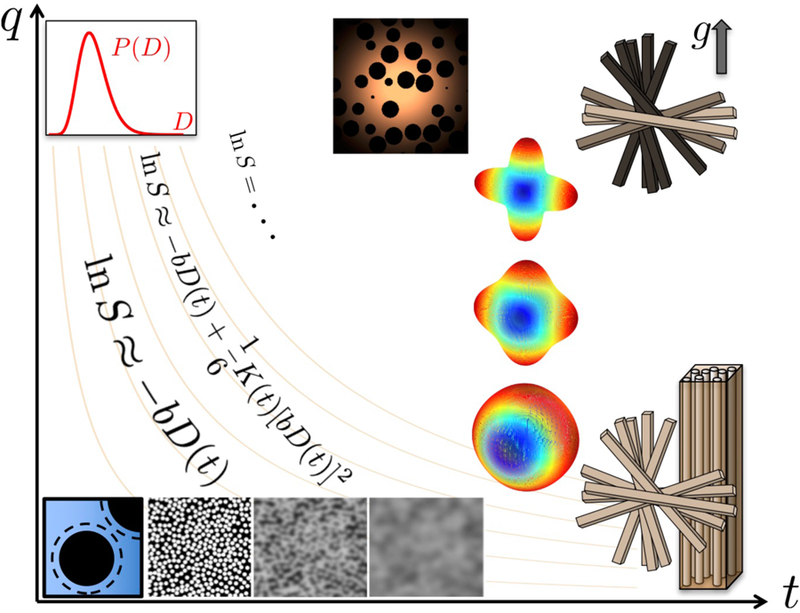
The parameter space of dMRI is at least twodimensional: By increasing q one accesses the progressively higher-order diffusion cumulants, Sec. 1.8, whereas the dependence along the t-axis reflects their epvolution over an increasing diffusion length scale , Eq. (1.12). The b-value alone does not uniquely describe the measurement, unless diffusion in all tissue compartments is Gaussian; contour lines of b = q2t are schematically drawn in beige. Large-q limits: Top-left is high-resolution limit L(t) ≪ lc, qlc ≫ 1, Sec. 1.5(i); middle is the , limit of probing the pore correlation function, Sec. 1.6. The hierarchy of dMRI models (pictures), cf. Fig. 4, as well as the cumulant representation with different number of terms, cf. Fig. 5, are superimposed. The decrease of the signal from axonal bundles parallel to the increasing gradient is shown by their darkening (top right). In Section 2 we move along the t-axis at low q, and in Section 3 we move along the q-axis at asymptotically long t. Section 4 is devoted to effects beyond this diagram, contained in voxelaveraged products of propagators at different t and q.