
FIG. 7.
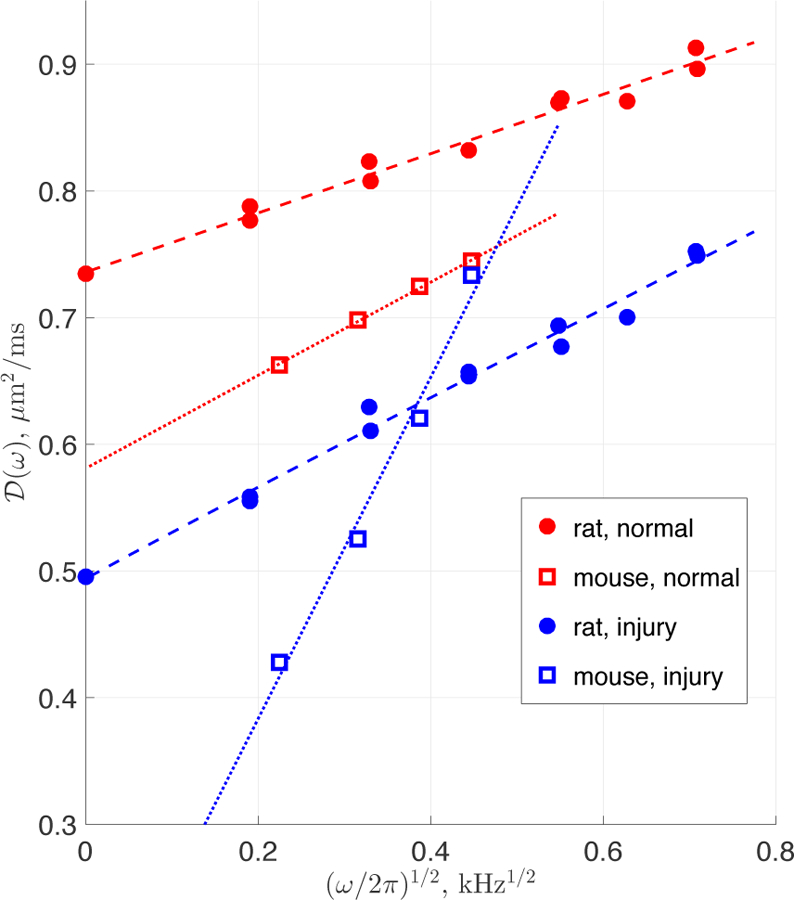
OGSE measurements in cortical GM: circles are data from average of 5 rats [123] and squares from 6 neonatal mice at 24 hours after unilateral hypoxic ischemic injury [126]. Red: normal rat brain and contralateral side of mouse brain. Blue: globally ischemic rat and ipsilateral side of hypoxia-ischemia injured mouse brain. PGSE data not shown. Dashed lines are fits from Fig. 4 of ref. [33], dotted lines are ω1/2 fits (shown as guide to the eye; power-law exponent fit for mouse data was not robust due to narrow frequency range). Note that while the absolute (ω) values differ between rat and mouse, the general features are similar: data is well described with ω1/2 behavior for normal and ischemic GM (except, possibly, the ischemic mouse, where major structural changes may have occurred in 24h); and the coefficient in front of ω (the slope) increases in ischemia, consistent with short-range structural disorder increase along the neurites (e.g., due to beading).