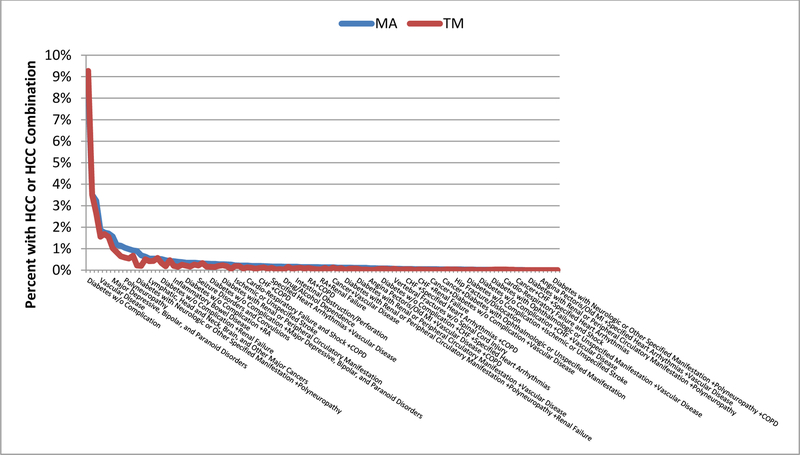
Figure 1.
Distribution of TM and MA Enrollees by HCC
*The MA distribution has been reweighted using inverse probability weights to reflect the age, gender, and geographic distribution of the TM sample. More specifically the weight for a TM or MA beneficiary i in HCC j in HRR k in age group m (65–69,70–74,75–79,80+) and gender group n is: . To avoid distorting the chart, the proportions for those with No HCCs are not shown. In TM that proportion is 65% versus 52% in MA.

