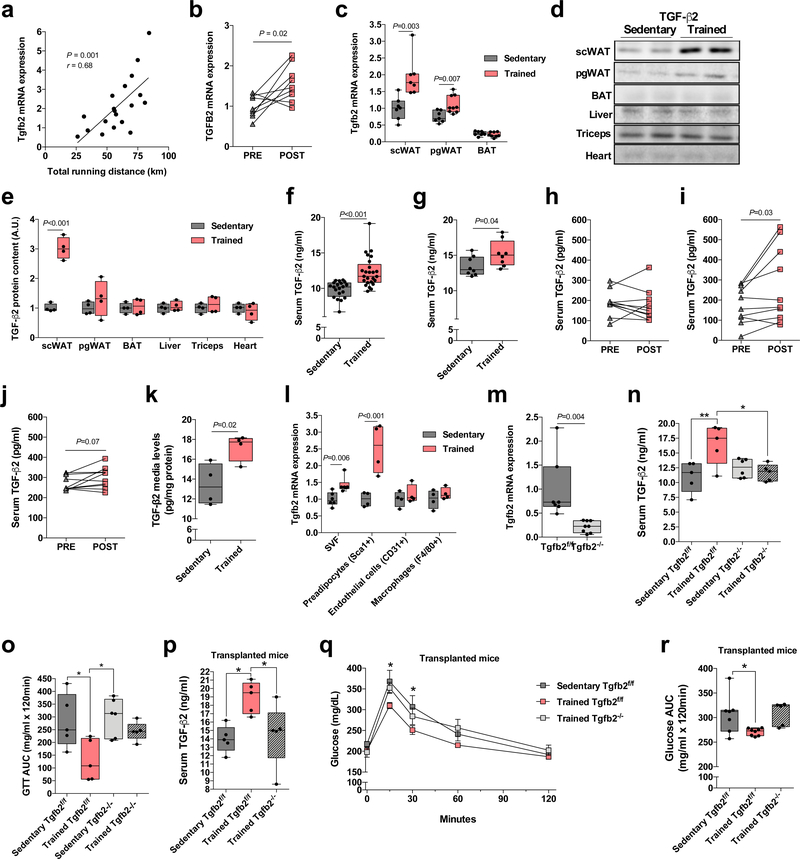
Figure 1.
TGF-β2 is an exercise-induced adipokine. (a) Pearson correlation coefficient was used to determine the correlation between Tgfb2 mRNA expression and running distance in trained mice; n=19 mice. (b) Tgfb2 mRNA expression in human scWAT pre-and post-aerobic exercise training; n=9 subjects. (c) Tgfb2 mRNA expression in scWAT, pgWAT and BAT in sedentary and trained mice; n=7 (scWAT), 8 (pgWAT) and 7 (BAT) sedentary mice, and n=7 (scWAT), 9 (pgWAT) and 8 (BAT) trained mice. (d) Representative immunoblot and (e) quantification of TGF-β2 content in adipose tissue, liver, triceps, and heart of sedentary and trained mice. n=4 mice. (f) Serum TGF-β2 concentrations; n=20 sedentary mice, n=25 trained mice. (g) Serum TGF-β2 concentrations in sedentary and trained mice fed a high fat diet; n=8 mice. (h) Serum TGF-β2 concentrations in healthy subjects pre-and post-12 weeks of moderate-intensity exercise training; n=9 subjects. (i) Serum TGF-β2 concentrations in healthy subjects pre-and post-6 weeks of a combined aerobic and resistance exercise training protocol; n=10 subjects. (j) Serum TGF-β2 concentrations in healthy subjects pre-and post-two weeks of high-intensity cycling exercise trainin; n=10 subjects. (k) TGF-β2 concentrations were determined in the media of mature adipocytes isolated from sedentary and trained scWAT. Each datapoint represents pooled fat pads from 3 mice. n=4 biologically independent samples. (l) Tgfb2 mRNA expression in stromal vascular fraction, preadipocytes, endothelial cells, and macrophages isolated from scWAT; n=4 mice. (m) Tgfb2 mRNA expression in scWAT of adipose-specific Tgfb2 knockout (Tgfb2−/−) and control (Tgfb2f/f) mice; n=7 Tgfb2f/f and 8 Tgfb2−/− mice. (n) Serum TGF-β2 concentrations in sedentary and trained Tgfb2f/f and Tgfb2−/− mice; n=5 or 6 mice/group. (o) Glucose tolerance test (GTT) area under the curve in trained Tgfb2f/f and Tgfb2−/− mice. n=5 or 6 mice/group. (p) Serum TGF-β2 concentrations in recipient mice transplanted with scWAT from trained Tgfb2−/− mice. n=5 mice/group. (q) GTT and (r) GTT area under the curve in recipient mice transplanted with scWAT from trained Tgfb2−/− mice. n=7 Sedentary Tgfb2f/f, n=8 Trained Tgfb2f/f, n=5 Trained Tgfb2-/−. Data are presented as box plots (min, max, median, and 25th and 75th percentiles) with dots as individual values (c, e, f, g, k, l, m, n, o, p, r), mean ± s.e.m (q) or individual values (a, b, h, i, and j). Paired two-tailed Student’s t-tests were used for b, h, I and j. Unpaired two-tailed Student’s t-tests were used for c, e, f, g, k, l and m. ANOVA was used for n, o, p, q and r. When ANOVA showed P<0.05, Tukey’s multiple comparisons tests were used with *P<0.05; **P<0.01.

