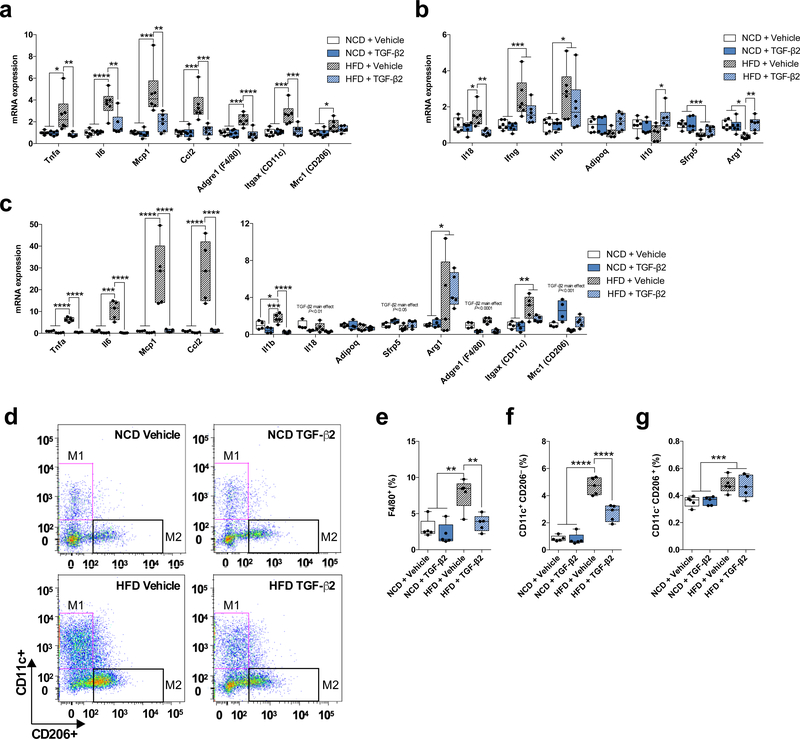
Figure 5.
TGF-β2 treatment attenuates high fat diet-induced inflammation in adipose tissue. (a,b) Expression of (a) pro-inflammatory and (b) anti-inflammatory markers in pgWAT in normal chow diet-fed (NCD) and HFD mice treated with TGF-β2; n=6 mice. (c) Levels of mRNA for inflammatory markers in peritoneal macrophages isolated from NCD and HFD mice and treated with TGF-β2; n=4 mice. (d) Representative image of flow cytometry experiment. (e) Percentage of macrophages (F4/80+) infiltrated in pgWAT in NCD and HFD mice treated with TGF-β2; n=5 mice. (f) Percentage of M1 and (g) M2 macrophages infiltrated in pgWAT in NCD and HFD mice treated with TGF-β2; n=5 mice. Data are presented as box plots (min, max, median, and 25th and 75th percentiles) with dots as individual values (a, b, c, e, f, and g). ANOVA was used for a, b, c, e, f and g. When ANOVA showed P<0.05, Tukey’s multiple comparisons tests were used with *P<0.05; **P<0.01, ***P<0.001, ****P<0.0001.

