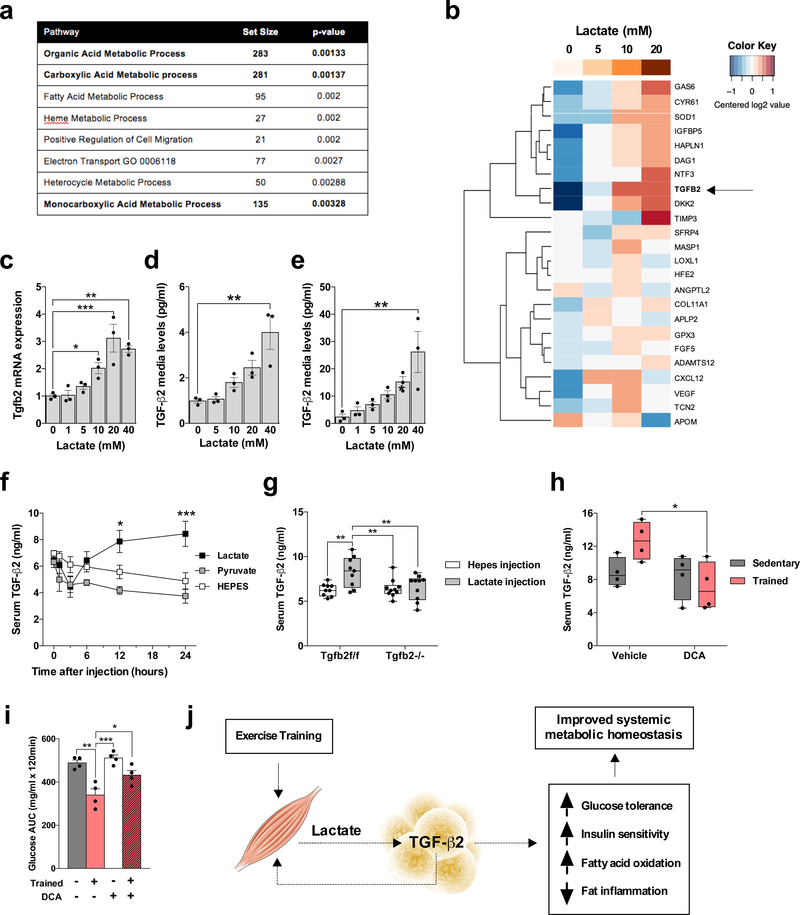
Figure 6.
Lactate produced by exercise training stimulates TGF-β2. (a) Most significant pathways correlated to Tgfb2 expression in scWAT microarray in trained mice. (b) Human adipocytes response to lactate. Putative adipokine genes selected from previous scWAT microarray of trained mice. -ΔCt data were centered for each row to have a mean of zero; a color bar representing lactate concentration is shown at the top. (c) Tgfb2 mRNA relative expression in human adipocytes treated with different concentrations of lactate; n=3 biological replicates. (d,e) TGF-β2 media concentration in (d) 3T3-L1 adipocytes and (e) human adipocytes treated with lactate; n=3 biological replicates. (f) TGF-β2 serum concentration in mice injected with lactate, pyruvate, or vehicle (HEPES) intraperitoneally; n=4 mice. (g) Serum TGF-β2 concentration in Tgfb2f/f and Tgfb2−/− mice 24 hours after a lactate injection. (h) Serum TGF-β2 concentration in trained mice and/or daily treated with dichloroacetate (DCA) injections; n=4 mice. (i) Glucose tolerance test (GTT) area under the curve in trained mice after daily dichloroacetate (DCA) injections; n=4 mice. (j) Proposed model of exercise training effects on lactate-TGF-β2 signaling axis. Data are presented as box plots (min, max, median, and 25th and 75th percentiles) with dots as individual values (g and h), or mean ± s.e.m (c, d, e, f, and i). ANOVA was used for c, d, e, f, g, h and i. When ANOVA showed P<0.05, Tukey’s multiple comparisons tests were used with *P<0.05; **P<0.01, ***P<0.001.

