. 2019 Apr 1;8:e43818. doi: 10.7554/eLife.43818

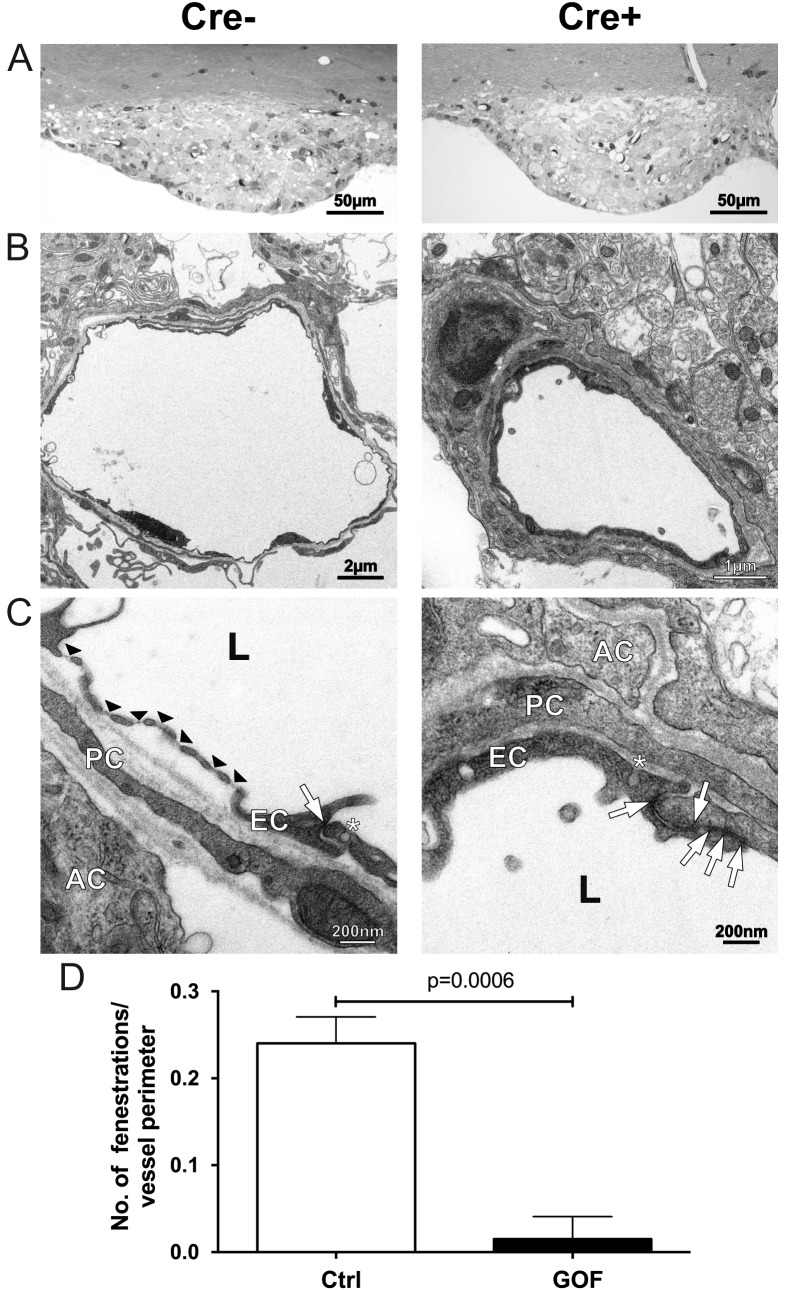
Figure 7. Tightening of vessels in the subfornical organ (SFO) on cellular level.

(A) Semithin sections of SFO of endothelial-specific β-catenin GOF (Cre+) and controls (Cre-). Electron microscopic picture of Cre- (B), (C), left column) and Cre+ (B), (C), right column). Black arrow heads indicate fenestrations, with arrows endothelial junctions, asterisks show vesicles. AC, astrocyte; EC, endothelial cell; L, lumen; PC, pericyte. (D) Number of fenestrations are quantified in three vessel sections per animal (n = 4). Error bars show ±SEM.

Figure 7—source data 1. Quantification of endothelial fenestrations in the vasculature of the subfornical organ (SFO) in Cdh5(PAC)-CreERT2:Ctnnb1Ex3fl/wt mice.
DOI: 10.7554/eLife.43818.027

Figure 7.

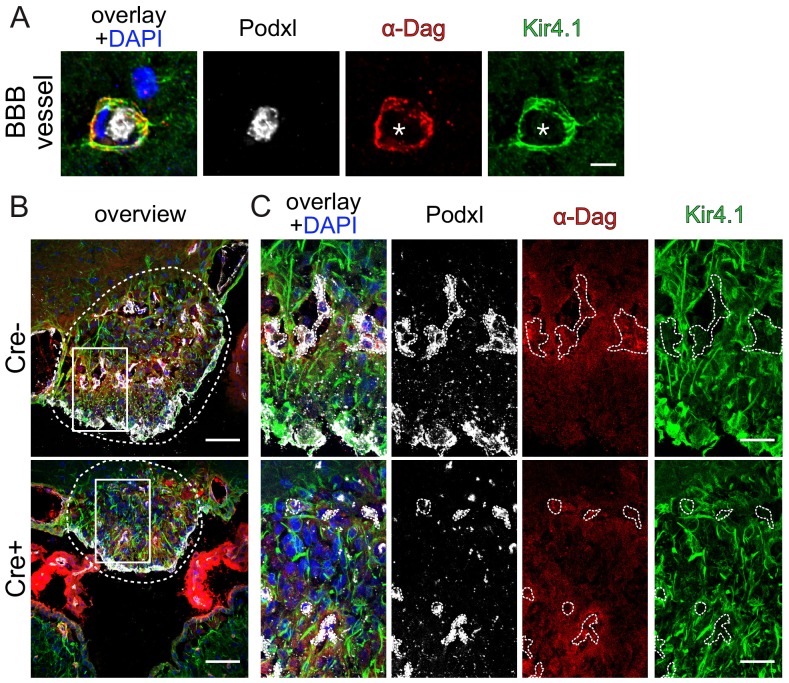
Figure 7—figure supplement 1. Endothelial β-catenin GOF does not affect astrocytic endfoot polarization of α-dystroglycan (α-Dag) and Kir4.1 within the subfornical organ (SFO).

Figure 7—figure supplement 1.

Striatal BBB-vessel showing a polarized distribution of α-Dag and Kir4.1 in AC endfeet. Lumen is stained by Podxl (asterisk) (A). Coronal overview of the subfornical organ (SFO) (B); rectangular inset demarcates area for higher magnification in (C). Dashed lines outline SFO vessels. Scale bar show 2 µm (A), 50 µm (B), 10 µm (C).
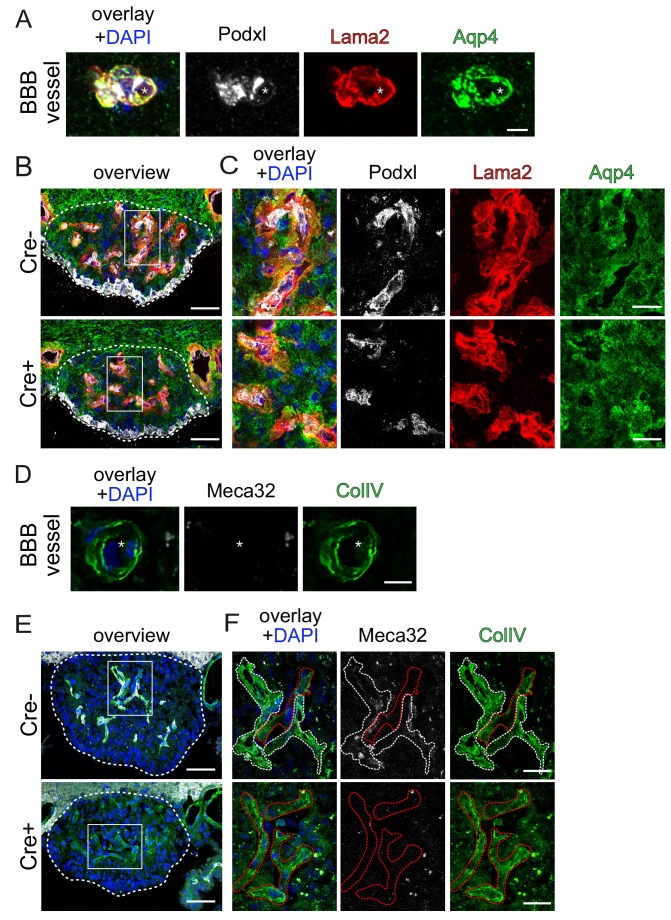
Figure 7—figure supplement 2. Endothelial β-catenin GOF does not affect the ECM of astrocytic endfeet and ECs within the subfornical organ (SFO).

Figure 7—figure supplement 2.

Striatal BBB-vessel showing a polarized distribution of Lama2 and Aqp4 in AC endfeet. Lumen is stained by Podxl (asterisk) (A). Coronal overview of the subfornical organ (SFO) (B); rectangular inset demarcates area for higher magnification in (C). Striatal BBB-vessel showing a polarized distribution of ColIV (green) but no Meca32 (white) in ECs (D). Coronal overview SFO, rectangular inset demarcates area for higher magnification in F (E); white dashed lines show Meca32+, red dashed lines show Meca32 vessels (F). Dashed lines outline SFO vessels; scale bars show 2 µm (A), 50 µm (B), 10 µm (C), 2.5 µm (D), 50 µm (E), 10 µm (F).