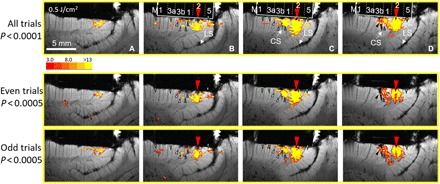
Fig. 6. Reliability of activation.

Panels A, B, C and D represent adjacent slices. Top row: Original panels (Fig. 5 C, n = 13 trials) showing feed-forward (green arrowheads) and feedback (white and blue arrowheads) connections from point stimulation in area 2 (red arrow). Middle row: Sum of even trials (n = 6). Bottom row: Sum of odd trials (n = 7). Since half as many trials will have lower statistical power, we used P < 0.0005 for half-trial images (middle and bottom rows) instead of the P < 0.0001 used for all trials (top row). Comparison of the half-trials reveals that the images are largely similar (from monkey #3).
