
Fig. 3. Simulated change of surface air pollution in China.
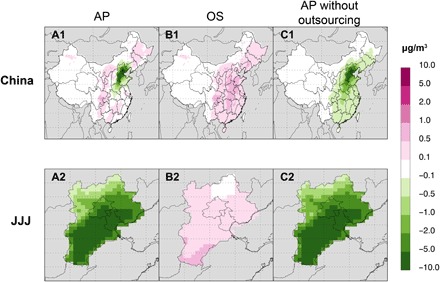
(A1) JJJ clean air policy impact, (B1) effect of outsourced emissions, and (C1) without outsourced emissions. (A2, B2, and C2) Maps zooming into the JJJ region. All figures include effects from changes in production and atmospheric transport of pollutants. Results are shown for monthly mean concentration of surface PM2.5 in January. The color scale is nonlinear to better present the wide range of impacts over different regions. The ambient PM2.5 concentration across China is simulated by the GEOS-Chem model using emissions under BAU, JJJ clean air policy scenario (AP), and outsourcing effects (OS) scenario (table S5). (A1) AP shows the overall changes of PM2.5 concentration due to the impacts of the JJJ clean air policy. (B1) OS shows the increase in PM2.5 concentration due to outsourcing, i.e., increase in production and pollution in the rest of China and associated atmospheric transport of pollution. (C1) AP without outsourcing illustrates the reduction in PM2.5 concentration due to the JJJ clean air policy without taking into consideration outsourcing of emissions to other regions in China.