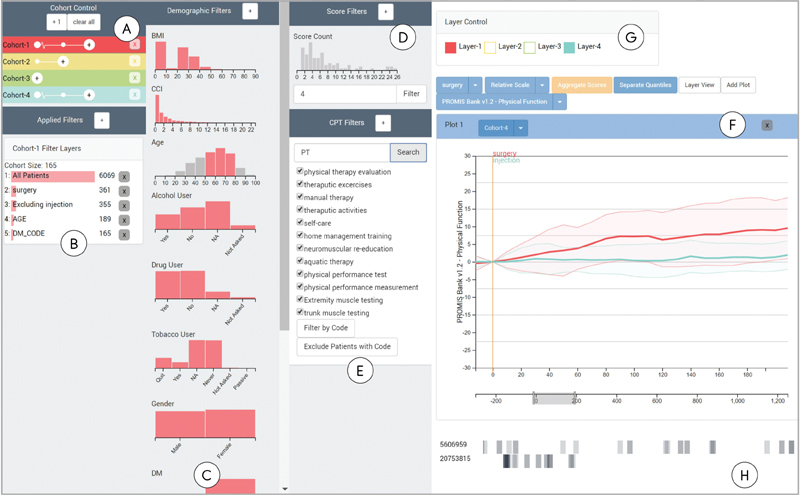
Fig. 1.

Composer overview. Composer consists of interfaces for flexibly defining cohorts, and for displaying the physical function scores of patients treated for back problems over time in these cohorts. ( A ) Patient cohorts can be added and branched in the cohort control interface. ( B ) A history of all filters applied to the selected cohort. Cohorts can be defined using ( C ) filters applied to demographic information, ( D ) recorded score frequencies, ( E ) and presence or absence of procedural codes. ( F ) The main interface is a chart showing either individual lines or aggregated areas. A zero-point for the PROMIS scores, indicated by the horizontal red line , can be flexibly defined to align all patients by a specific event, such as a medical intervention. ( G ) The layer panel provides the ability to hide layers corresponding to the cohorts. ( H ) Users can select individual patient lines to show orders associated with their medical records in the timeframe specified in the timeline below the main plot. Selected patients are identified by their patient id, shown on the left-hand side of the event line.
