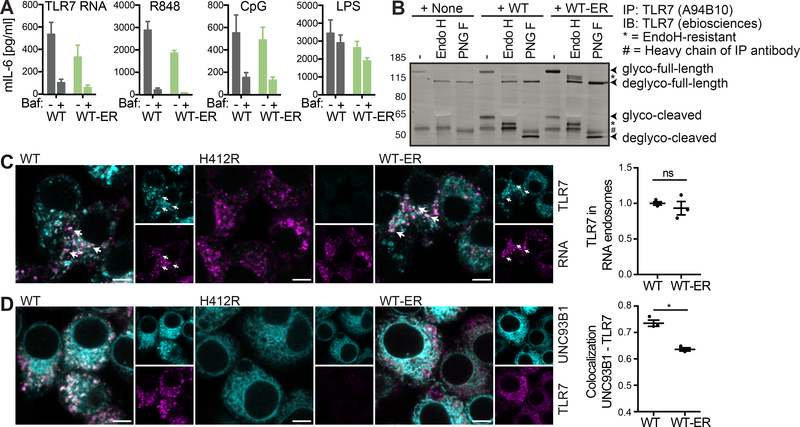
Figure 5. ER-retained UNC93B1 is sufficient to restore TLR trafficking to TLR ligand containing compartments.
(A) Unc93b1−/− iMOs expressing UNC93B1 WT or WT-ER were pre-incubated for 30 min with 10 nM bafilomycin (where indicated), stimulated for 5 h with 12.5 ng/ml R848, 4 μM TLR7 RNA, 50 nM CpG1826 or 12.5 ng/ml LPS, and supernatants were analyzed for secreted IL-6 by ELISA. Data are combined from three independent experiments (mean + SEM). (B) TLR7 was immunoprecipitated from Unc93b1−/− iMOs expressing the indicated versions of UNC93B1-mCitrine. IPs were denatured and either left untreated or deglycosylated using the enzymes Endoglycosidase H (H) or Peptide-N-Glycosidase F (F), as indicated. Data are representative of three independent experiments. (C) Unc93b1−/− iMOs expressing the indicated versions of UNC93B1-mCitrine were incubated with biotinylated TLR7-stimulatory RNA coupled to fluorescently labeled streptavidin. 45 min upon addition of the biotinylated RNA-streptavidin complexes, cells were fixed, permeabilized and stained for TLR7 using the A94B10 anti-TLR7 antibody. The graph shows mean object-based colocalization of TLR7 with RNA vesicles relative to cells expressing UNC93B1 WT. Each data point represents the mean of one independent experiment with thousands of RNA vesicles each. Shown are data from three independent experiments (mean + SEM). Shapiro-Wilk normality test showed normal distribution of data, paired t-test showed no significance (p=0.44). Scale bars: 5 μm. (D) Unc93b1−/− iMOs expressing the indicated versions of UNC93B1-mCitrine were fixed, permeabilized and stained for TLR7 using the A94B10 anti-TLR7 antibody. The graph represents the overall correlation between UNC93B1 and TLR7 with each data point representing one independent experiment. Shown are data from three independent experiments (mean + SEM). Shapiro-Wilk normality test showed normal distribution of data, paired t-test revealed significance (p=0.019). Please also see Figure S3 for endogenous UNC93B1 and TLR7. Scale bars: 5 μm.

