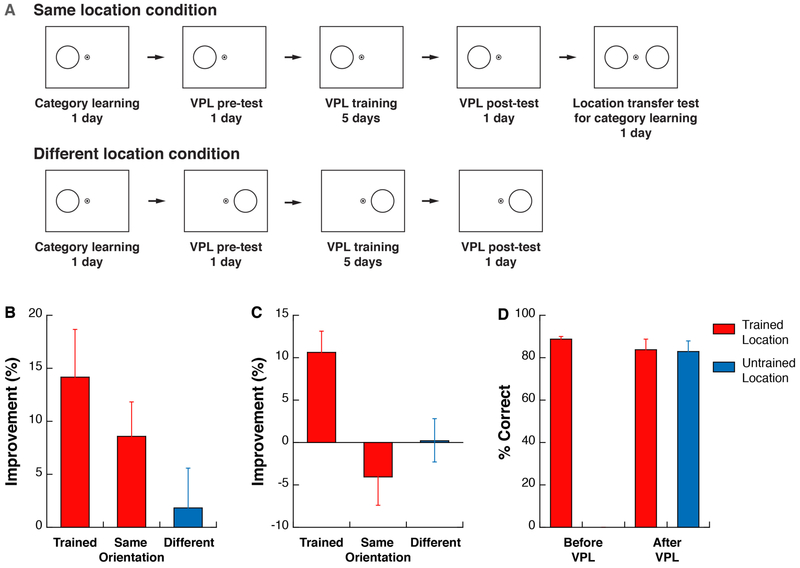
Figure 3.
Procedures and results of Experiment 2. A. The stages of the experiment. Circles represent stimuli. B. The mean (±SEM) improvement (%) for the VPL trained orientation (Trained), an untrained orientation belonging to the same category as the trained orientation (Same) and an untrained orientation beyond the category of the trained orientation (Different) in the same location condition. Stimuli for category learning and for VPL were presented at the same location. C. The mean (±SEM) improvement (%) in the different locations condition in which stimuli for category learning and for VPL were presented in different visual hemifields. D. The mean (±SEM) correct % in the category learning (before VPL) in the left visual hemifield and location transfer test (after VPL). The red bars represent the correct percentages in the last 10 trials of the category training (before VPL) and in the location transfer test (after VPL) in the same location as in the category training. Similar high correct mean percentages were obtained from the data for each of the first 3 and 5 trials for the location transfer test in both the trained and untrained visual hemifields. The blue bar represents the correct percentage in the location transfer test (after VPL) when the stimuli were presented in the different visual hemifield than in the category training. See also Figure S2 and Figure S3.

