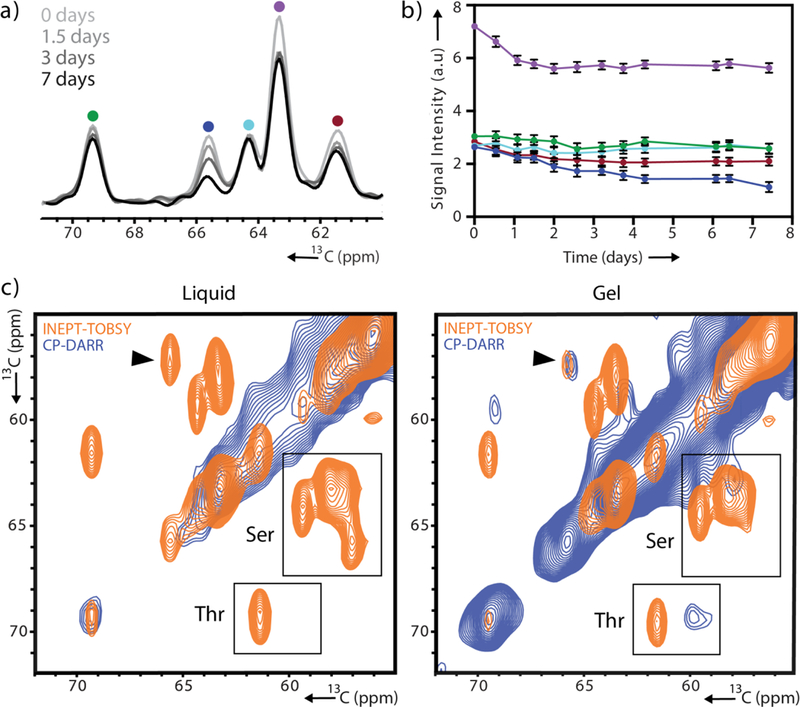
Figure 2.

Site-specific variation in the gelation dynamics of pHP1α. (a) 1D INEPT spectra collected 0, 1.5, 3 and 7 days after initiation of phase separation. (b) Signal intensity of the five peaks shown in (a) tracked over time with colors corresponding to the color scheme in (a). For error analysis, see SI. (c) Serine/threonine region of 2D 13C-13C CP-DARR and INEPT-TOBSY spectra recorded 3 hours after droplet formation and 7 days later. A black arrow denotes the serine cross-peak with greatest signal loss.
