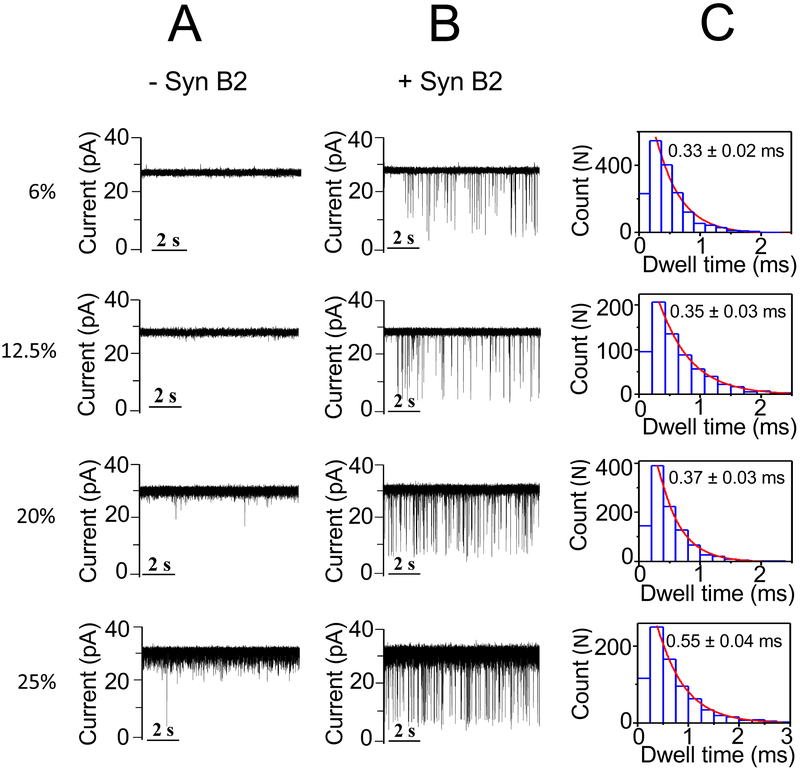
Figure 4: Single-channel electrical recordings of the αHL protein pore in the presence of Syn B2 and in PEG-8k-containing solutions.
(A) The figure illustrates representative single-channel electrical traces in the absence of Syn B2, but in the presence of PEG-8k of varying concentration; (B) Representative single-channel electrical traces acquired when 20 μM Syn B2 was added to the trans side and in the presence of PEG-8k of varying concentration; (C) Representative dwell time histograms of the Syn B2-induced current blockades obtained at each examined PEG concentration. The fittings of the dwell-time histograms were executed using a single-exponential probability function. They were validated by a logarithm likelihood ratio (LLR) test.57, 58 Single-channel electrical traces were processed using a 1 kHz low-pass Bessel filter. The [PEG-8k] values are indicated on the left side. PEGs were symmetrically added to both sides of the chamber. The other experimental conditions were the same as those stated in the caption of Fig. 2.

