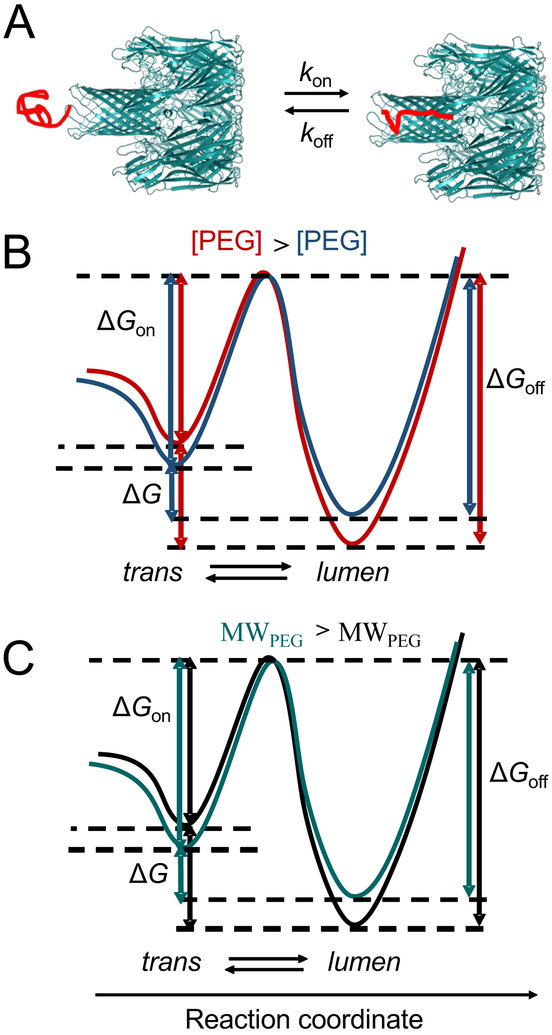
Figure 6: Free energy profile of the Syn B2-αHL interactions.
(A) Cartoon showing the two substates of the Syn B2 polypeptides, in the trans conformation (“trans”) and under nanopore confinement (“lumen”); (B) Qualitative representation of the free energy profile at an increased concentration of less-penetrating PEGs; (C) Qualitative representation of the free energy profile at an increased PEG molecular size.

