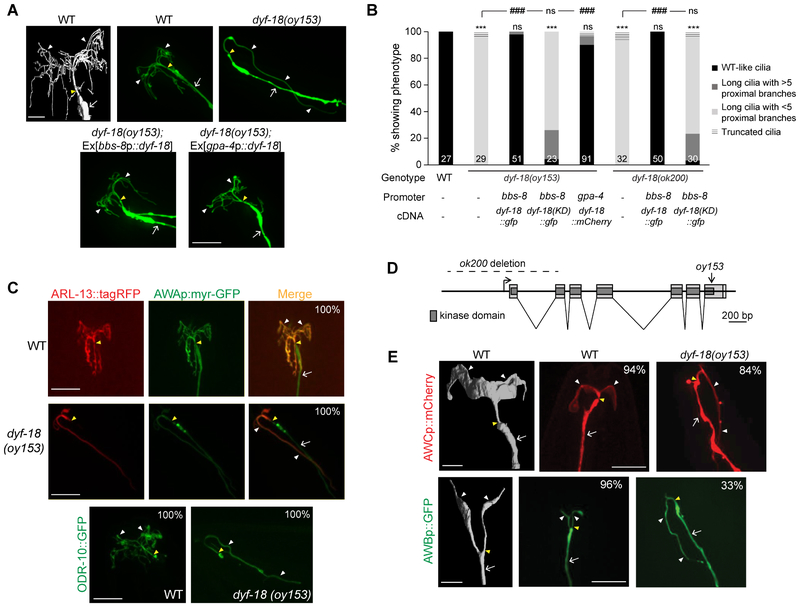
Figure 1. AWA olfactory neuron cilia are unbranched and elongated in dyf-18 CCRK mutants.
A) (Top left) 3D reconstruction model of the cilia of an AWA neuron (adapted from [5]). Scale bar: 2 μm. (Top right and bottom) Representative images of AWA cilia in the indicated genetic backgrounds. Cilia were visualized via expression of gpa-4Δ6p::myr-gfp. The cilia base and cilia are indicated by yellow and white arrowheads, respectively; the dendrite is marked by an arrow. Anterior is to the top left in all images. Scale bar: 10 μm.
B) Percentage of adult hermaphrodites of the indicated genotypes exhibiting AWA cilia phenotypes. bbs-8 and gpa-4Δ6 regulatory sequences drive expression in all ciliated neurons and in AWA alone, respectively. KD: kinase-dead. Cilia were visualized using gpa-4Δ6p::myr-gfp or gpa-4Δ6p::myr-mCherry. Numbers in each bar indicate the number of examined neurons in 2-3 independent experiments. For transgenic strains, combined data from two independent lines are shown. *** and ### indicate different from wild-type and corresponding mutant, respectively, at P<0.001; ns – not significant (Wilcoxon rank-sum test).
C) Representative images of localization of ARL-13::tagRFP (top) and ODR-10::GFP localization (bottom) in wild-type and dyf-18 animals. Cilia were visualized via expression of gpa-4Δ6p::myr-gfp in images at the top. The cilia base and cilia are indicated by yellow and white arrowheads, respectively; the dendrite is marked by an arrow (the dendrite is not visible in the bottom panels). Numbers at top right indicate the percentage of neurons exhibiting the shown phenotypes; n≥30 neurons each in 3 independent experiments. Anterior is at top or at top left in all images. Scale bars: 10 μm.
D) Gene structure of dyf-18. Filled light and dark gray boxes indicate exons and the kinase domain, respectively. The extent of the deletion in ok200 and the location of the oy153 mutation are indicated.
E) (Left panels) 3D reconstruction models of AWC (top) and AWB (bottom) cilia (adapted from [5]). Scale bar: 2 μm. (Right panels) Representative images of AWC and AWB cilia in the indicated genetic backgrounds. AWC and AWB cilia were visualized via expression of odr-1p::dsRed and str-1p::gfp, respectively. Numbers at top right indicate the percentage of neurons exhibiting the shown phenotypes; n≥30 neurons each in 3 independent experiments. The cilia base and cilia are indicated by yellow and white arrowheads, respectively; the dendrite is marked by an arrow. Anterior is at top in all images. Scale bars: 10 μm.
Also see Figure S1.

