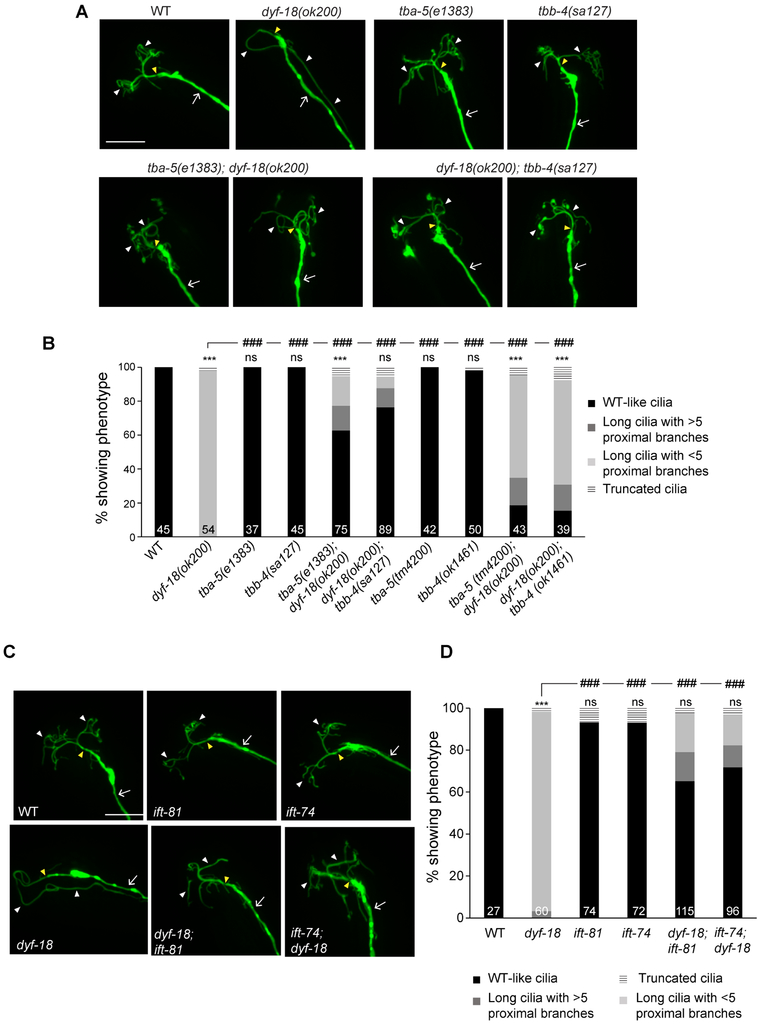
Figure 6. Destabilizing axonemal MTs or disrupting tubulin-IFT interactions suppresses the dyf-18 AWA cilia phenotype.
A, C) Representative images of AWA cilia morphologies in animals of the indicated genotypes. AWA neurons were visualized via expression of gpa-4Δ6p::myr-gfp. The cilium base and cilium are indicated by yellow and white arrowheads, respectively; the dendrite is marked by an arrow. Alleles used in C were dyf-18(ok200), ift-81(tm2355), ift-74(tm2393). Anterior is at top or at top left in all images. Scale bar: 10 μm. Animals were grown at 15°C in A.
B, D) Percentage of AWA neurons in adult hermaphrodites of the indicated genotypes exhibiting cilia phenotypes. Alleles used in D were dyf-18(ok200), ift-81(tm2355), ift-74(tm2393). Numbers in each bar indicate the number of examined neurons in 2-3 independent experiments. *** and ### indicate different from wild-type and indicated values, respectively, at P<0.001; ns – not significant (Wilcoxon rank-sum test). Animals were grown at 15°C in B.
Also see Figure S3, Figure S4, and Table S2.

