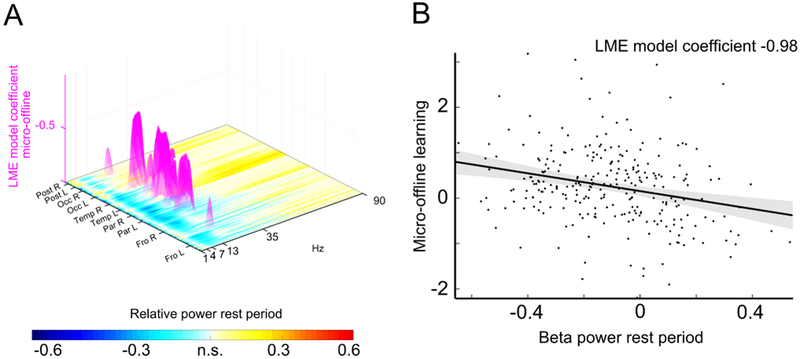
Figure 3. Micro-offline learning occurs in a state of low beta power.
A, Brain oscillatory activity during rest periods predictive of micro-offline learning. The horizontal plane depicts the relative power during rest periods compared to resting-state baseline across spectra (x-axis, 1–90 Hz) and cortex (y-axis, 548 locations clustered at frontal (Fro), parietal (Par), temporal (Temp), occipital (Occ) and cerebellar (Post) lobes). Warm yellow colors depict significant power increases during rest periods compared to resting-state baseline, cold blue colors significant power decreases (two-tailed one-sample t tests, n = 27). The z-axis depicts the strength of the inverse relationship between oscillatory power and micro-offline learning (linear-mixed effects (LME) model coefficient, n = 10 trials × 27 participants) at the significant frequencies and locations (magenta). All P<0.05im, FDR-corrected for multiple comparisons. Note that only beta oscillatory activity at 16–22 Hz in frontoparietal areas was predictive of micro-offline learning. B, Inverse relationship between frontoparietal beta oscillatory activity during rest periods and micro-offline learning (n = 10 trials x 27 participants). See also Figure S3 for predictive oscillatory activity for micro-scale learning. See also Table S1.

