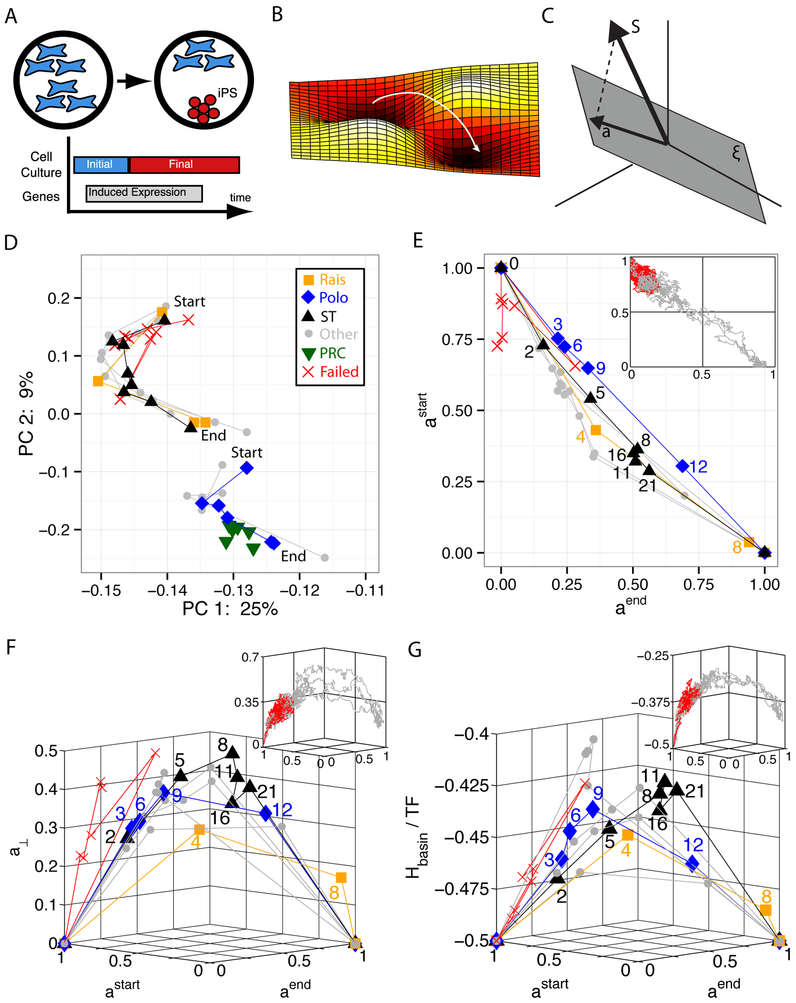
FIG. 1: Cellular Reprogramming Reaction Coordinate.
A. Transient expression of reprogramming genes plus switching culturing conditions probabilistically leads to the desired cell type. B. Reprogramming is commonly described as the crossing of a barrier in a high-dimensional landscape. C. Our proposed cellular identity landscape is based on the projection, a, of an arbitrary gene expression, S, onto the subspace (gray plane) spanned by the natural cell types, . D. Principal component analysis (PCA) of reprogramming from mouse embryonic fibroblasts (MEF) to induced pluripotent stem cells (iPSC) with start marking day 0 and end marking iPSC. Rais8, Polo9, and ST (Samavarchi-Tehrani)29 are three successful trajectories in which the explicit time in days is labeled on plots E, F, and G. Other represents additional successful trajectories, PRC are partially reprogrammed cells, and failed trajectories do not reprogram. E. Projection onto astart (MEF) and aend (iPSC) only. All successful trajectories follow a simple reaction coordinate in projection space, a straight line from (astart = 1, aend = 0) to (astart = 0, aend = 1). Insets in E, F, and G are simulation data with failed trajectories in red and successful trajectories in gray. See SI Fig. 2for larger version of simulations. F. Measure of projection on all other cell types, a⊥ vs. the reaction coordinate. See SI Fig. 3 for larger version of simulations. G. Energy landscape of basins of attraction, Hbasin, per transcription factor (TF) vs. reaction coordinate. See SI Fig. 4 for larger version of simulations.

