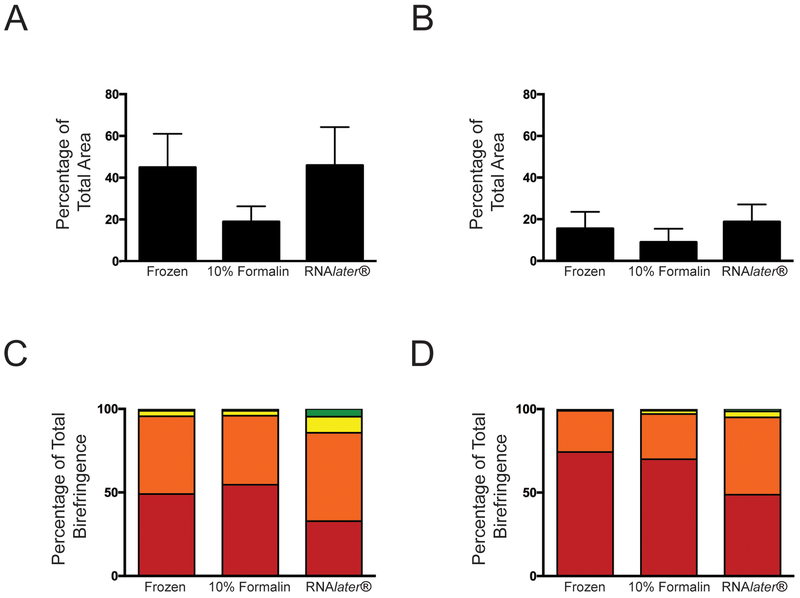
Figure 2.
Quantification of birefringence measured in aortic valve leaflets stained with picrosirius red showing birefringence as a measure of total area within the fibrosa (A) and spongiosa (B). Color of birefringence as a percentage of total birefringence in the fibrosa (C) and spongiosa (D). Red refers to red birefringence (bottom), followed by orange, yellow and green.

