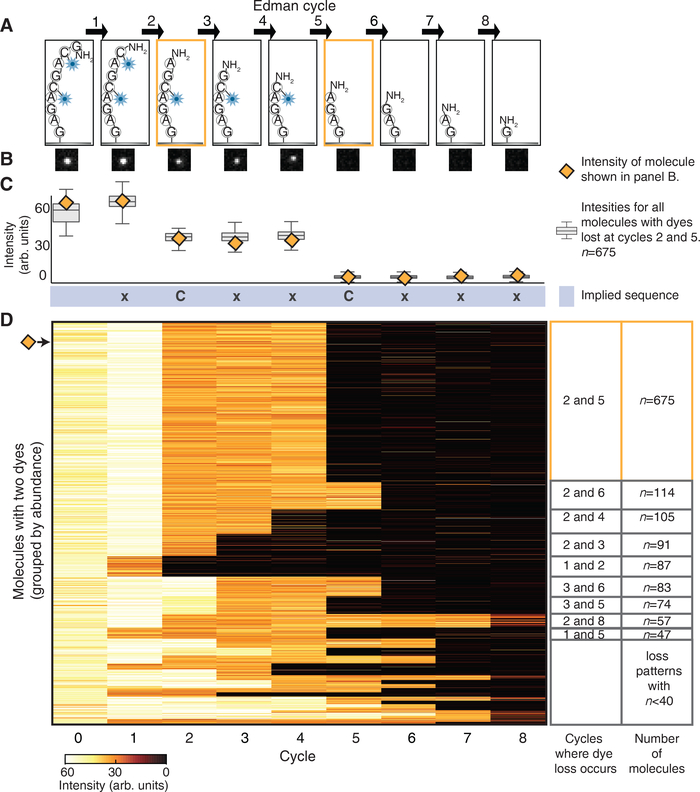
Figure 3: Step-wise decreases in fluorescent intensity occur at the Edman cycles that correspond to the removal of the dye-labeled amino acids.
(A) A schematic of the peptide molecule, GC♦AGC♦AGAG, losing dye labeled amino acids at the 2nd and 5th Edman degradation cycles. ♦indicates Atto647N conjugated to cysteine. (B) The decrease in fluorescence intensity accompanying dye loss is illustrated in a representative set of TIRF images for a single peptide molecule. (C) Intensities for the representative molecule shown in panel B (orange diamond) and a box plot of intensities (Center line, median; limits, 75% and 25%; whiskers, +/− 1.5 IQR) for all 675 molecules collected across all 49 images correctly identified as having drops at amino acid positions 2 and 5. By noting the Edman cycle corresponding to the step-wise intensity decrease, the partial sequence of the peptide (xCxxCxxx) can be inferred. (D) The heatmap of fluorescent intensity values for each of the 1,695 peptides with two dyes, observed after every Edman cycle, shows that the predominant pattern corresponds to dye losses after the 2nd and 5th cycles (n=675 peptide molecules).

