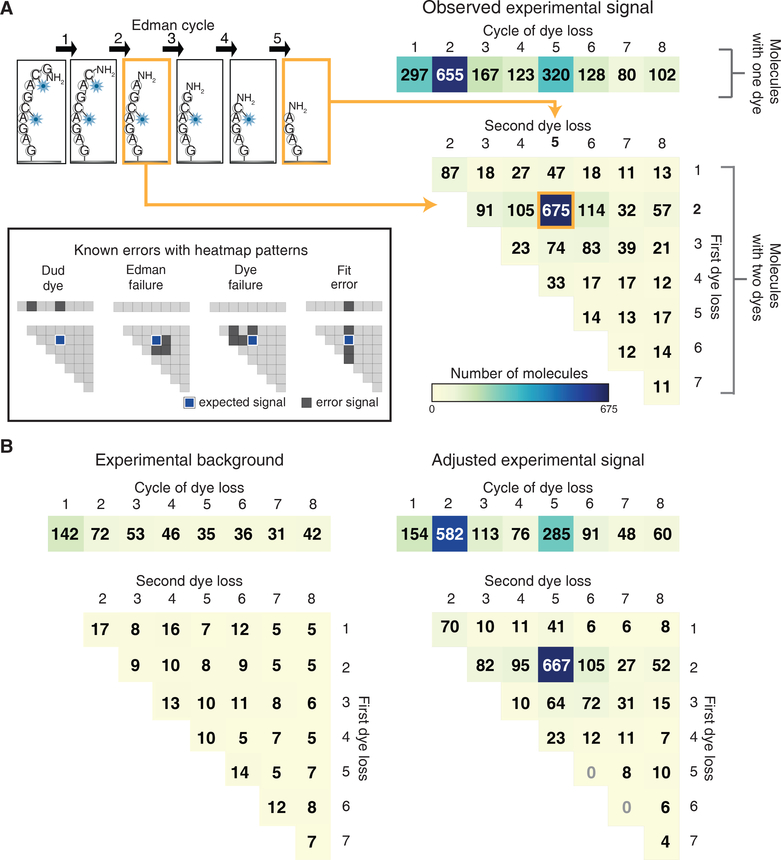
Figure 4: Fluorescent sequences can be interpreted computationally to identify dye positions and quantify errors.
A maximum likelihood statistical model allows for correct sequencing of multi-labeled peptides, evident in (A) histograms of the fit fluorescent sequences obtained for GC♦AGC♦AGAG (right panels, based on 49 image fields;♦indicates Atto647N conjugated to cysteine). We summarized dye loss positions for peptides with only one detectable dye as a 1D histogram (top right panel) and dye loss positions for doubly labeled peptides as a 2D histogram (bottom right histogram). As an aid for interpreting the 2D histogram, the example at top left shows a schematic of a peptide exhibiting dye losses at the 2nd and 5th cycles, which correspond to the 2nd row and 5th column of the 2D histogram. 675 peptide molecules exhibited this pattern. In this experiment, all other patterns correspond to specific sequencing errors, as illustrated graphically in the inset at left. (B) By sequencing an N-terminally acetylated population over 49 image fields of the same sequence, background observations expected from non-Edman events were determined (left panel) and the foreground counts adjusted to determine the signal above background (right panel, see Methods for calculation).

