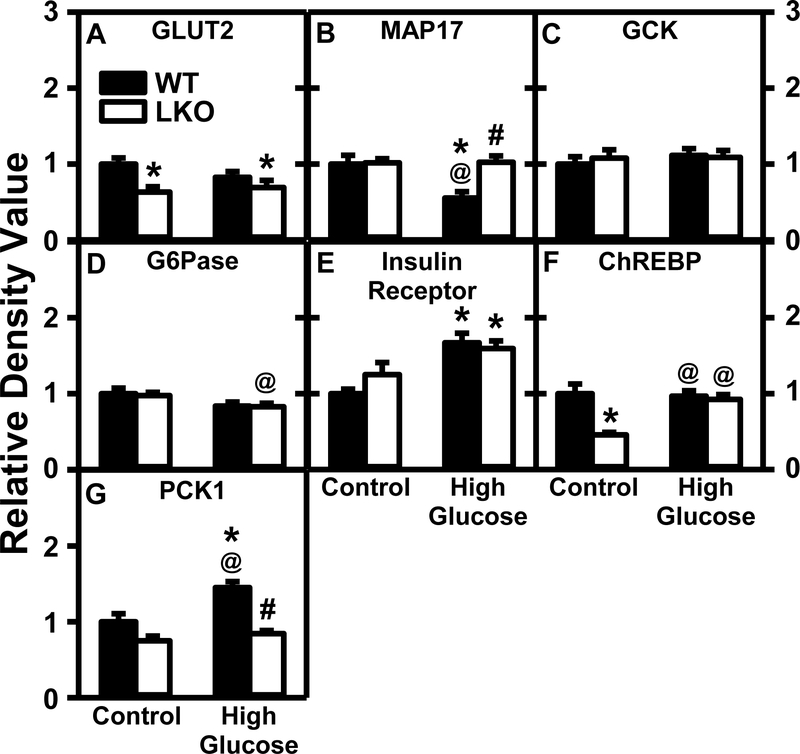
Figure 11. Impact of Lfabp gene ablation (LKO) and pair-fed high glucose diet (HGD) on protein levels of key liver enzymes/proteins in hepatic glucose metabolism.
All conditions were as described in Fig. 9 except that SDS-PAGE and Western blotting were performed to determine relative hepatic protein levels of the following groups of key proteins in hepatic glucose metabolism: Group 1: Glucose uptake, i.e. GLUT2 (Fig. 11A; Supplemental Fig. 16A), MAP17 (Fig. 11B; Supplemental Fig. 16B); Group 2: glucose metabolism, i.e. GCK (Fig. 11C; Supplemental Fig. 17A), G-6-Pase (Fig. 11D; Supplemental Fig. 11A); Group 3: regulation of glucose uptake, i.e. insulin receptor (Fig. 11E; Supplemental Fig. 11A), ChREBP (Fig. 11F; Supplemental Fig. 13A); and Group 4: gluconeogenesis, i.e. PCK1 (Fig. 11G; Supplemental Fig. 17B). Western blot images for each protein (n=7) along with GAPDH, COX4, or β-actin housekeeper for normalization are shown in the respective Supplemental Figs. 4–17. WT (Black bars) and LKO (Open bars). Values represent the mean ± SEM, n=7, with statistical significance indicated as follows: * p≤ 0.05 vs WT mice on control diet; @ p≤ 0.05 vs LKO mice on control diet; and #p≤ 0.05 vs WT mice HGD.

