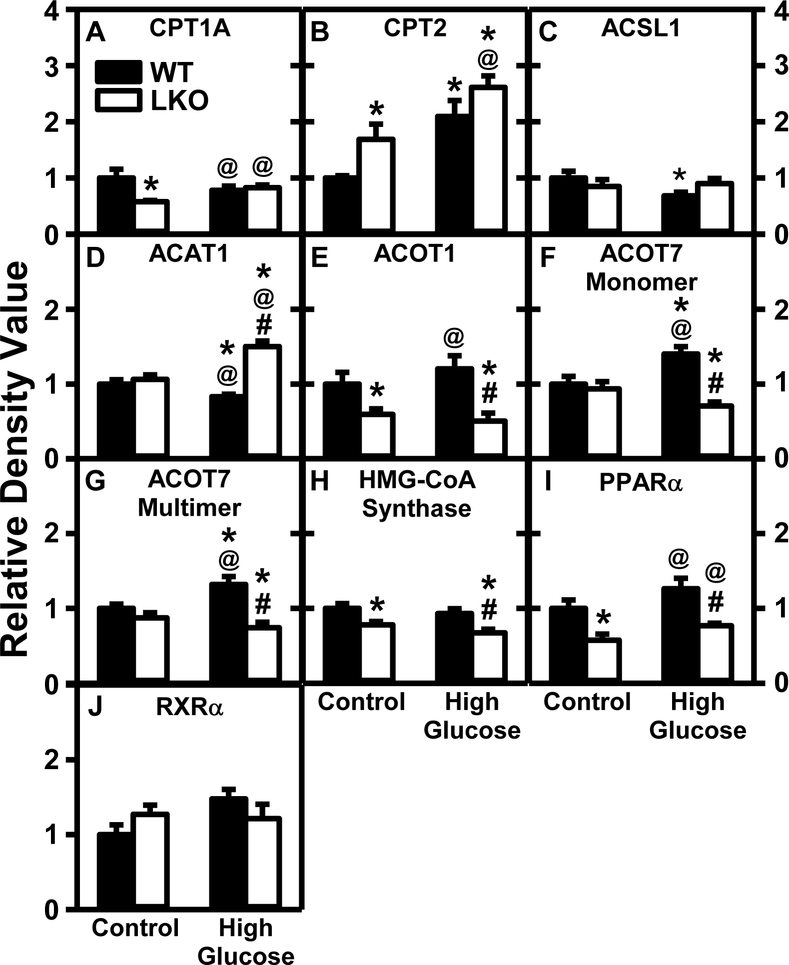
Figure 12. Lfabp gene ablation (LKO), but not pair-fed high glucose diet (HGD), diminish hepatic protein levels of key liver enzymes/proteins in mitochondrial β-fatty acid oxidation.
All conditions were as described in Fig. 9 except that SDS-PAGE and Western blotting were performed to determine relative hepatic protein levels of the following groups of key proteins in mitochondrial β-fatty acid oxidation: Group 1: fatty acid uptake across mitochondrial membranes into mitochondrial matrix, i.e. CPT1A (Fig. 12A; Supplemental Fig. 6A), CPT2 (Fig. 12B; Supplemental Fig. 6B), ACSL1 (Fig. 12C; Supplemental Fig. 7A,16B); Group 2: mitochondrial matrix enzymes in fatty acid oxidation, i.e. ACAT1 (Fig. 12D; Supplemental Fig. 7B), ACOT1 (Fig. 12E; Supplemental Fig. 8A), ACOT7 (Fig. 12F monomer and 12G multimer; Supplementary Fig. 8B), HMG-CoA synthase mitochondrial (Fig. 12H; Supplemental Fig. 9A); Group 3: nuclear regulatory proteins of mitochondrial fatty acid oxidative enzymes, i.e. PPARα (Fig. 12I; Supplemental Fig. 9B), RXRα (Fig. 12J; Supplemental Fig. 9C). Western blot images for each protein (n=7) along with GAPDH, COX4, or β-actin housekeeper for normalization are shown in the respective Supplemental Figs. 4–17. WT (Black bars) and LKO (Open bars). Values represent the mean ± SEM, n=7, with statistical significance indicated as follows: * p≤ 0.05 vs WT mice on control diet; @ p≤ 0.05 vs LKO mice on control diet; and #p≤ 0.05 vs WT mice HGD.

