
Figure 1. scRNA-seq of the preoptic region in the mouse hypothalamus.
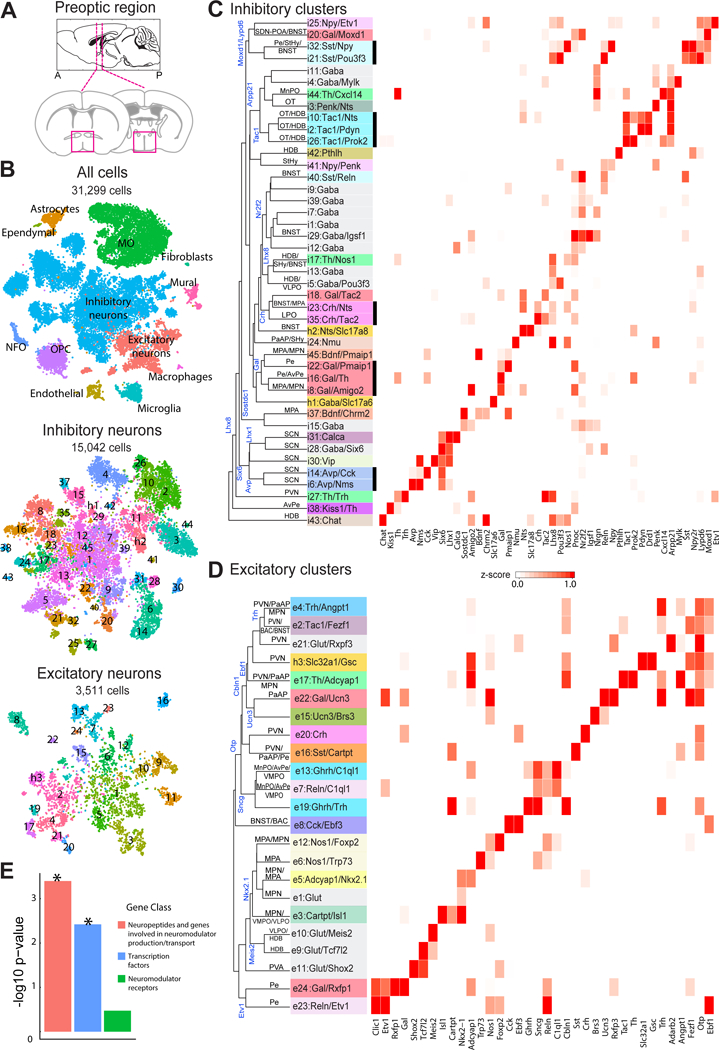
(A) Schematic of the preoptic region of the hypothalamus. Magenta boxes indicate the area dissected for scRNA-seq (Bregma +0.5 to −0.6). (B) t-distributed stochastic neighbor embedding (tSNE) for all cells, inhibitory and excitatory neurons, with cells colored by cluster. Numbers superimposed on the tSNE indicate the cluster ID. Total cell numbers for each tSNE plot are indicated. NFO: newly formed oligodendrocytes. OPC: oligodendrocyte progenitor cells. MO: mature oligodendrocytes. (C) Heat map of z-scores of expression for select genes within inhibitory neuronal clusters. Clusters are organized on the basis of the hierarchical tree constructed with expression in principal component space, with some of the genes differentially expressed between branches indicated (blue). The nomenclature of clusters uses a numeric indicator of excitatory or inhibitory cluster followed by one or two marker genes, with the first marker typically a neuromodulator (29). Inhibitory and excitatory clusters that lack a notable neuromodulator marker gene were designated as Gaba and Glut, respectively, with an additional marker gene to help differentiate among these clusters when possible. Cluster names are colored based on the first gene. Predicted anatomical locations for the clusters are listed on the tree and the unlabeled lines indicate that such prediction was not possible. Thick black lines underscore clusters grouped by common neuropeptide expression. (D) As in (C) but for excitatory neurons. The hybrid neuronal clusters h1/h2 and h3 are listed in (C) and (D) respectively, as they were initially classified as inhibitory and excitatory, respectively. (E) –log10(p-value) for the enrichment of gene categories in differentially expressed genes that mark neuronal clusters calculated based on a Gene-Set Enrichment Analysis (GSEA) as shown in fig. S6. * indicated p < 0.05.