
Figure 4. Neuronal clusters in the preoptic region as revealed by MERFISH.
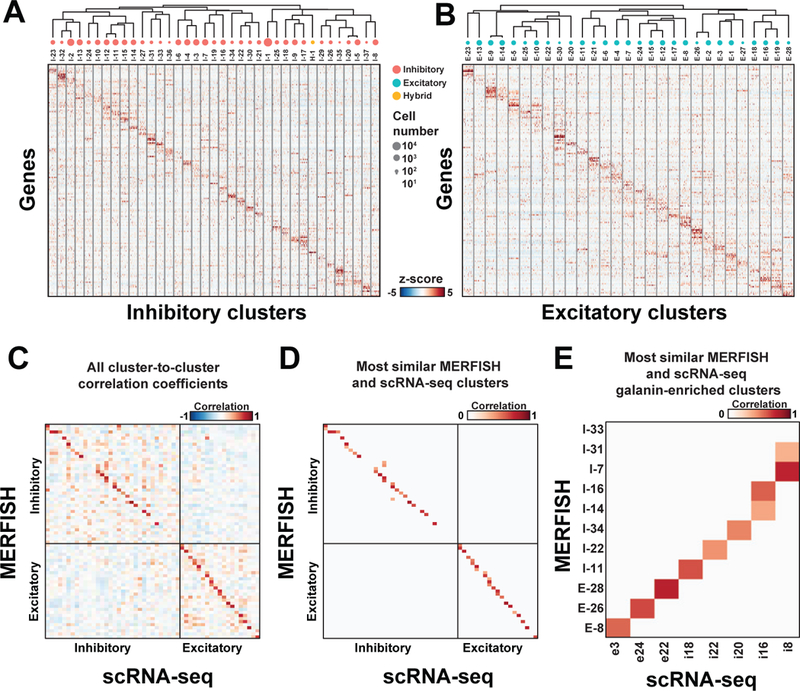
(A, B) z-scores of expression profiles for (A) inhibitory and (B) excitatory neuronal clusters identified with MERFISH. 100 random cells from each cluster are depicted. The neuronal clusters are organized on the basis of similarity in their expression profiles, as depicted by the dendrogram. The sizes of red, cyan and yellow circles indicate the abundance of neuronal clusters, and only clusters with more than 100 cells are depicted. H-1 is grouped with the inhibitory clusters as it was initially classified as inhibitory neurons. (C) The pairwise Pearson correlation coefficients between the expression profile (in z-score) of the MERFISH and scRNA-seq clusters. The order of the clusters in (C) is not the same as in (A, B). (D) As in (C) but with only scRNA-seq cluster(s) most similar to each MERFISH cluster shown, identified as the cluster(s) with the highest Pearson correlation coefficient(s) (fig. S14; Table S9) (29). When multiple scRNA-seq clusters show statistically indistinguishable, highest correlation coefficients to a MERFISH cluster (29), all of them are indicated. scRNA-seq clusters outside the region imaged by MERFISH, as assessed by the expression patterns of the marker genes in the Allen Brain Atlas (35) and our own in situ data (fig. S7) (29), are excluded from this analysis (29). (E) Same as (D) but for clusters enriched in galanin (Gal).