
Figure 5. The spatial organization of neuronal clusters in the preoptic region.
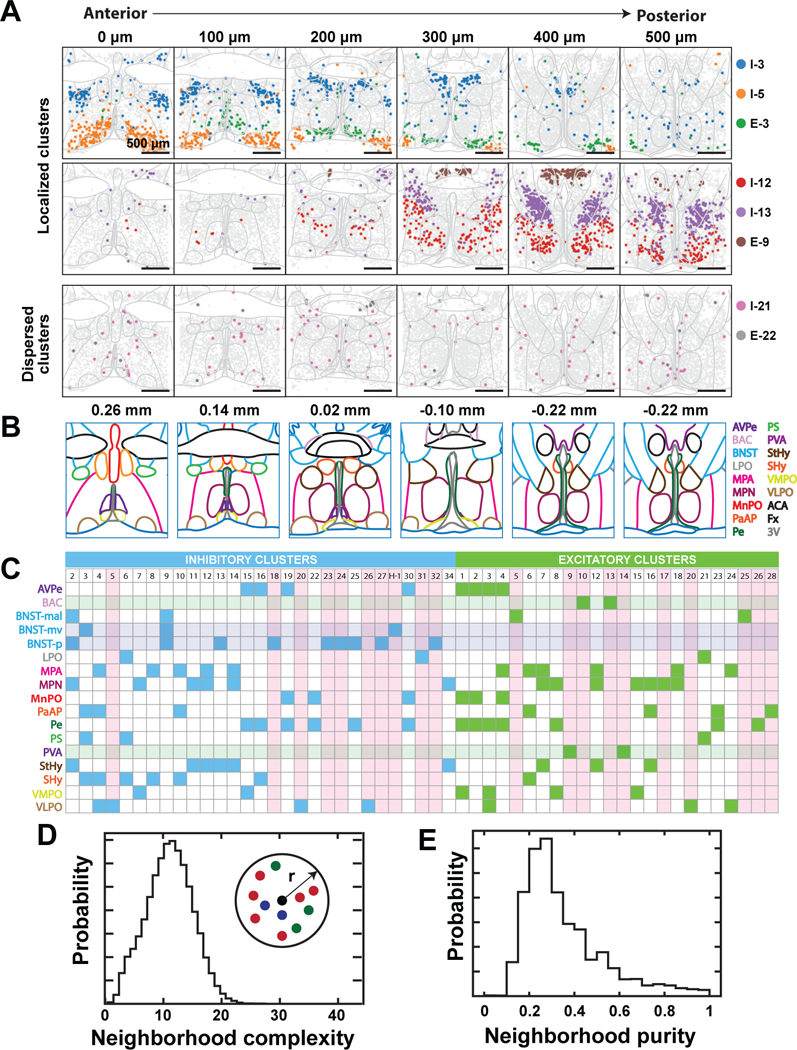
(A) Spatial distribution of example neuronal clusters that are localized (top and middle) or dispersed (bottom). Depicted are six of the twelve slices imaged from a female mouse. Colored markers indicate cells of the specified neuronal clusters and gray markers indicate all other neurons. Nuclei boundaries depicted in light grey are drawn according to (45) and aligned to the tissue slices based on the locations of landmarks, such as the anterior commissure, fornix, and ventricle. The 0, 100, 200, 300, 400, and 500 µm labels indicate the distance from the anterior position (Bregma +0.26). (B) Illustration of major hypothalamic nuclei spanning the imaged region and colored according to legend on the right (45). Nuclei abbreviations are as defined in Fig. 3F, and additionally, BAC: Bed nucleus of the anterior commissure; LPO: Lateral preoptic area; MPA: Medial preoptic area; PS: Parastrial nucleus; StHy: Striohypothalamic nucleus; SHy: Septohypothalamic nucleus; ACA: Anterior commissure; Fx: Fornix; 3V: Third ventricle. Bregma locations are listed on top and the map at Bregma −0.22 is duplicated. (C) Summary of nuclei in which inhibitory (blue) or excitatory (green) neuronal clusters are enriched. Translucent horizontal bars indicate nuclei that contain only inhibitory (blue) or excitatory (green) clusters. Vertical pink bars highlight clusters primarily enriched in single nuclei. BNST-mal: BNST, medial division, anterolateral part. BNST-mv: BNST, medial division, ventral part. BNST-p: BNST, posterior part. (D, E) Analysis of spatial mixing of distinct neuronal clusters. We define the complexity of the neighborhood surrounding any given neuron as the number of distinct neuronal clusters present within that neighborhood, and the purity of that neighborhood as the fraction of all cells within the given neighborhood that are part of the most abundant cluster. Probability distributions of the complexity (D) and purity (E) of the 100-µm-radius neighborhood surrounding any given neuron are depicted.