
Figure 7. Sub-divisions of neuronal populations expressing Gal or Adcyap1 revealed by MERFISH.
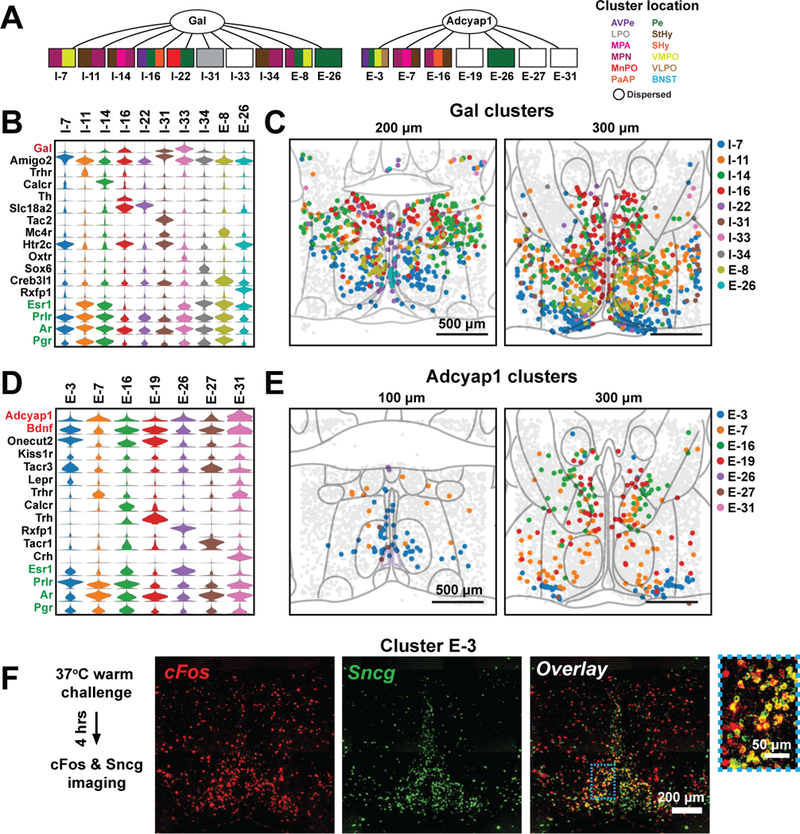
(A) MERFISH sub-divides galanin-expressing and Adycap1-expressing cells into multiple transcriptionally and spatially distinct clusters. Color subdivision of the rectangles shows the nuclei spanned by individual clusters, colored identically to the nuclei abbreviations listed on the right. The nuclei abbreviations are as defined in Figs. 3F, 5B. (B) Expression distributions of selected marker genes and genes of interest for all neuronal clusters enriched in galanin (Gal). Expression distributions are calculated as in Fig. 2. (C) Spatial distributions of all inhibitory and excitatory Gal-enriched clusters. (D, E) As in (B, C) but for Adcyap1- and Bdnf-enriched clusters. The seven most enriched of the 14 Adcyap1- and Bdnf-enriched clusters are shown. (F) in situ hybridization images of cFos (red), Sncg (green) and overlay of an anterior slice of the preoptic region taken from a heat-stressed animal. The blue boxed region is magnified and shown on the right. Sncg is a marker for the scRNA-seq cluster e13 which corresponds to the MERFISH cluster E-3 (Table S9).