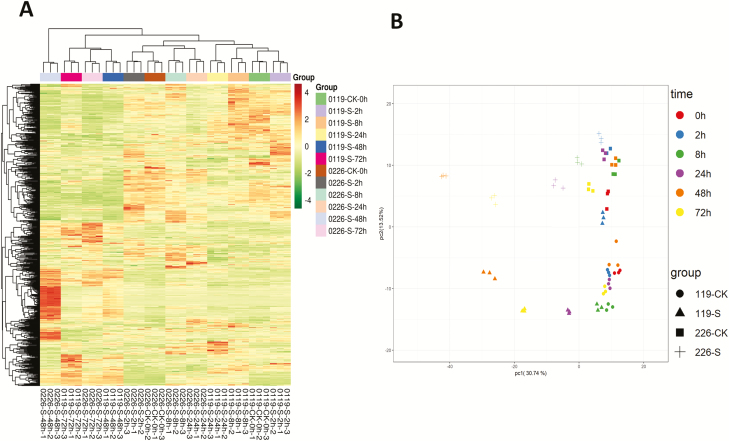
Figure 1.
(A) Heatmap hierarchical clustering of detected metabolites. Hierarchical trees were drawn based on detected metabolites in leaves of 0119 and 0226 at 0, 2, 8, 24, 48 and 72 h in control (CK) and salt stress treatment (S). The columns correspond to cultivar at different time points, while the rows represent different metabolites; (B) PCA loading plot of the two first principal components based on the metabolic data from leaves of 0119 and 0226 at 0, 2, 8, 24, 48 and 72 h in control (CK) and salt stress treatment (S).

