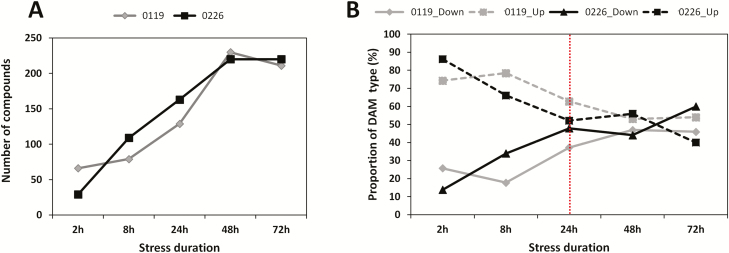
Figure 2.
Temporal changes of metabolic reprogramming in 0119 and 0226 under salt stress. (A) DAMs at 2, 8, 24, 48 and 72 h under salt stress; (B) proportion of DAM types (down- and up-accumulated) at 2, 8, 24, 48 and 72 h under salt stress. The red dashed line depicts the critical time point for salt stress endurance in hulless barley.

