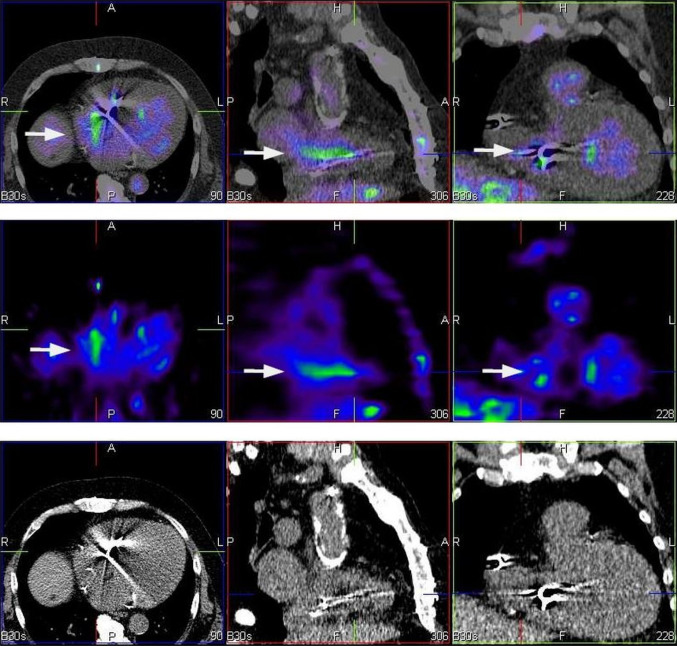
Fig. 1.
99mTc-HMPAO-SPECT/CT—study in three projections axial (left), sagittal (middle) and coronal (right). Bottom panel presents CT scans. Corresponding SPECT sections are presented in middle row and fusion images (99mTc-HMPAO-SPECT/CT) are placed in upper row. 99mTc-HMPAO-SPECT/CT shows an accumulation of radiolabeled leucocytes in the vicinity of an implanted electrode (arrows). In this case tracer uptake is consistent with CDRIE

