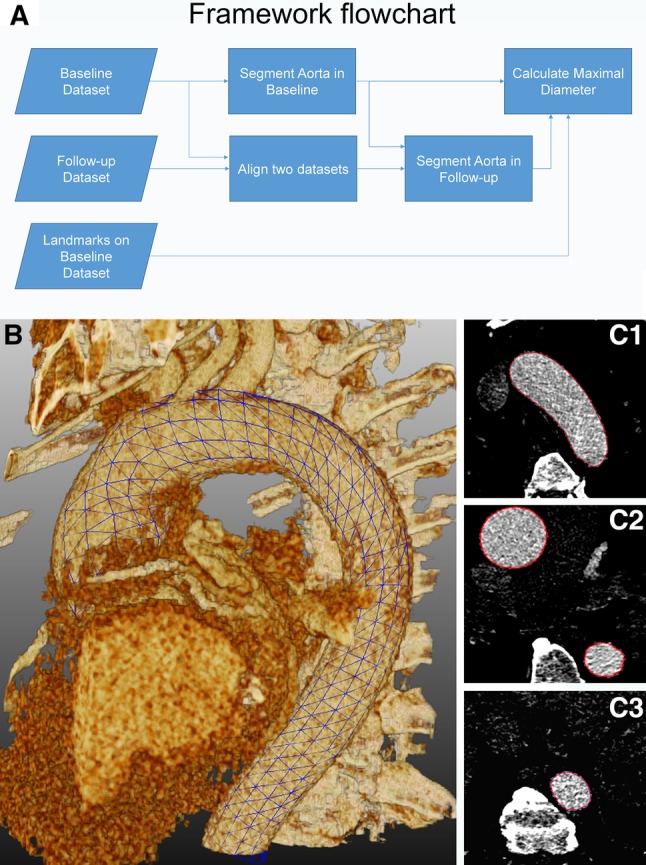
Fig. 2.

In a flowchart representing the main steps that were automated in the software to obtain the measurements from both baseline and follow-up datasets. 3D grid (b, blue grid) and 2D axial (C1–C3, red contours) views showing the result of semi-automatic segmentation. (Color figure online)
