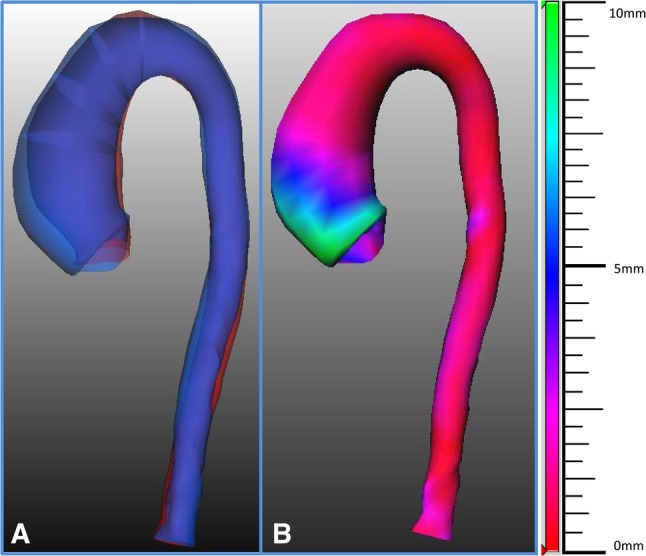
Fig. 3.

Tools for the visualization of the size changes in the aorta. In a superimposed three dimensional views of the surfaces of the thoracic aorta based on the semi-automatically segmented contour of both baseline (in red) and follow-up (in blue) CTA images. In b the semi-automatically calculated changes in diameters between the baseline and follow-up scans are represented with colors (red, blue and green indicate 0, 5 and 10 mm differences in diameters, respectively) for an immediate and comprehensive overview of the results. (Color figure online)
