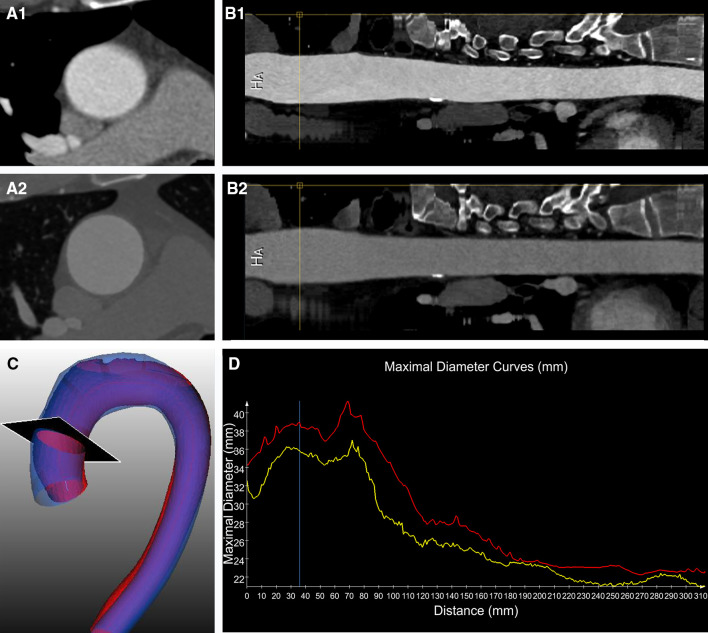
Fig. 4.
Tools for the visualization of the size change of the aorta. Cross-sectional views of the aorta (A1 and A2) and straightened MPR reconstructions (B1 and B2) of the aligned baseline (A1 and B1) and follow-up (A2 and B2) images. In C superimposed 3-dimensional views of the surfaces of the thoracic aorta based on the semi-automatically segmented contours of both baseline (in red) and follow-up (in blue) CTA images. In D the two diameters curves (baseline in yellow and follow-up in red), starting from the sinotubular junction, drawn together on the same graph. The black plane in C shows the level where the cross-sectional diameter indicated by the yellow lines in B1 and B2 and by the blue line in D was calculated. (Color figure online)

