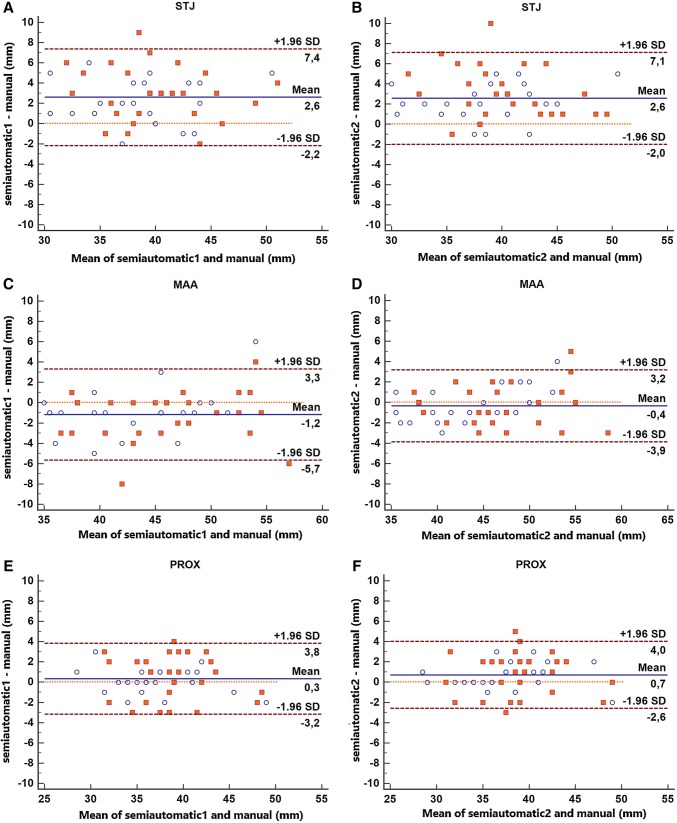
Fig. 5.
Bland–Altman plots representing the difference between semi-automatic and manual measurements at the sinotubular junction (a, b), MAA (c, d) and PROX (e, f). Blue circles: baseline diameters. Red squares: follow-up diameters. Semi-automatic 1 and Semi-automatic 2 = semi-automatically calculated diameters by observers 1 and 2, respectively. (Color figure online)

