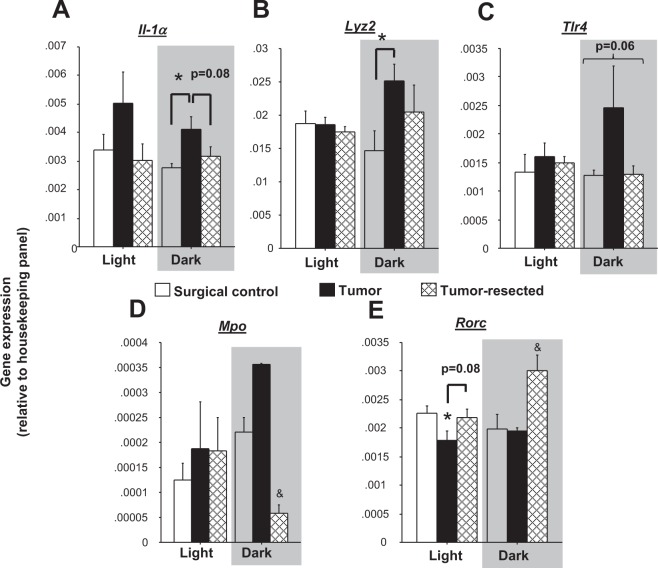
Figure 7.
Dark phase-specific effects of mammary tumors and tumor removal on inflammatory gene expression in the brain. Mean ± SEM gene expression as assessed by RT2PCR array of brain (A) Il1α (B) Lyz2, (C) Tlr4, (D) Mpo and (E) Rorc (n = 3–4/group). *p < 0.05 relative to control group at the same time point; &p < 0.05 relative to the other groups at the same time point by one-way ANOVA; #p < 0.05 relative to the same treatment during the light phase by two-way ANOVA.

