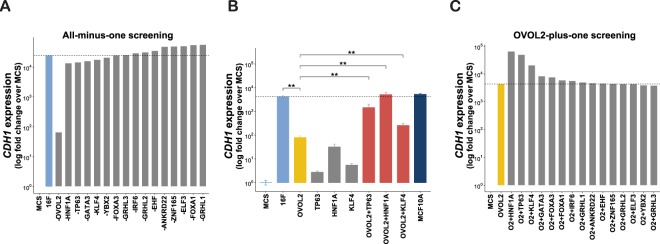
Figure 2.
Identification of TF combinations that induce E phenotype in fibroblasts. (A) Identification of indispensable factor(s) for CDH1 induction in HNDFs, using an all-minus-one screening approach. Quantitative RT-PCR (RT-qPCR) was performed to quantify CDH1 expression 7 days after transduction of the indicated factors in HNDF. (B) Statistics analysis of CDH1 induction by combination of OVOL2 with HNF1A, TP63 or KLF4. Results are presented as means ± S.D. of three biological replicates. **p < 0.01 (C) OVOL2-plus-one factor screening was performed to identify the cooperative partners of OVOL2 in inducing CDH1 expression in HNDF.

