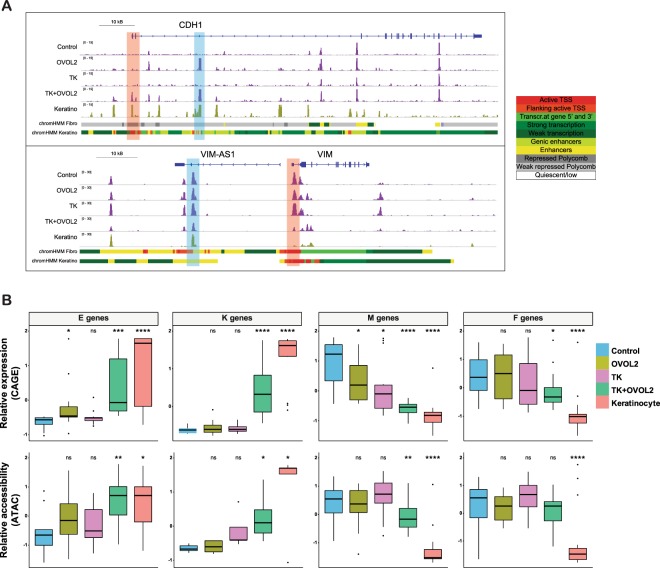
Figure 5.
Enhanced chromatin accessibility changes by OVOL2 combined with lineage factors. (A) Genome browser view of ATAC-seq signals at the CDH1 and VIM loci. Promoter and potential enhancer regions that showed enhanced changes by a combination of TK + OVOL2 are highlighted in red and blue, respectively. Roadmap annotation of genomic regions (promoters and enhancers for the indicated cell types) is shown at the bottom. (B) A box plot showing Z-scores for expression (CAGE, top) or chromatin accessibility (ATAC, bottom) in E, M, K, and F genes, respectively. p-values were calculated through comparison with control samples. *p < 0.01, **p < 0.001, ***p < 0.0001, ****p < 0.00001.

