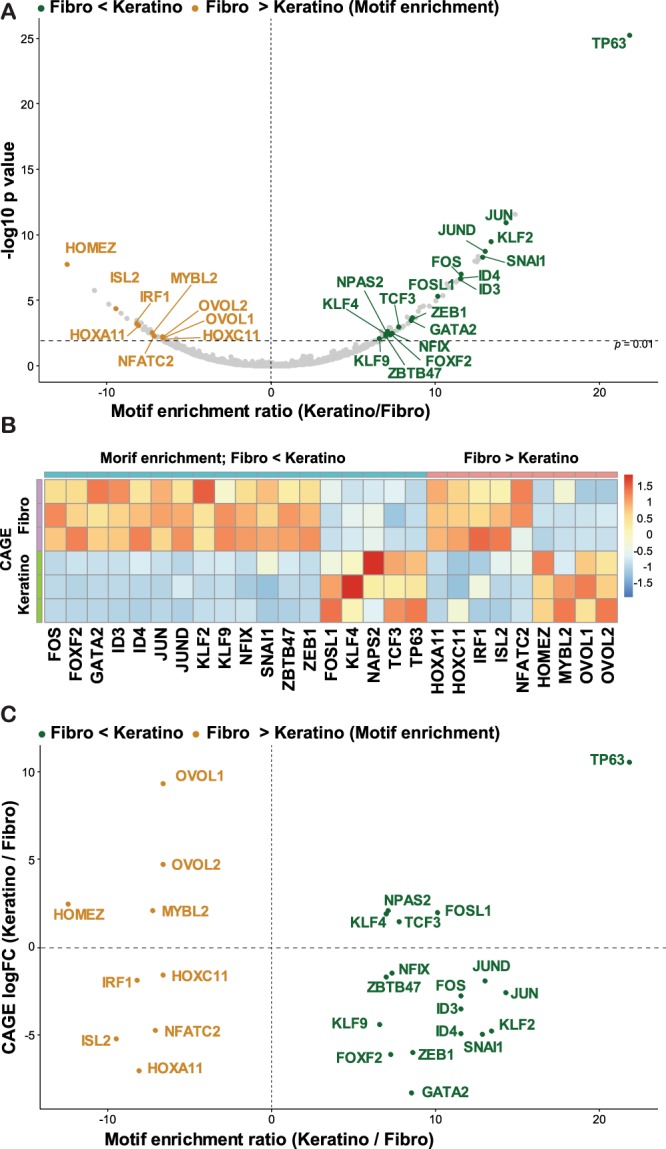
Figure 6.

Motif accessibility and TFs expression between fibroblast- and keratinocyte-lineages. (A) Top differentially accessible TF motifs between fibroblasts and keratinocytes. TFs that showed significant differences in CAGE expression (q < 0.01 and |log fold change| > 1) were labeled. (B) Heatmap for the expression levels of the indicated TFs in FANTOM5 CAGE data. Three replicates for primary dermal fibroblasts and keratinocytes are shown. (C) A scatter plot of TFs by motif enrichment score (=Z score, x axis) and CAGE expression fold changes (y axis).
