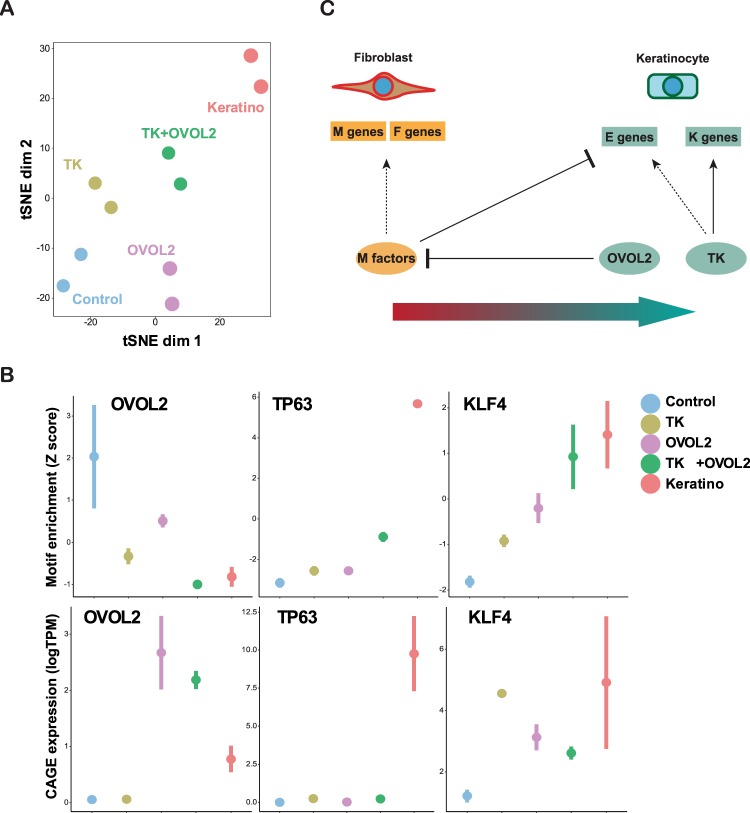
Figure 7.
Changes in motif accessibility and TF expression during reprogramming. (A) tSNE plot using TF motif enrichment scores for each condition based on the ATAC-seq data. (B) Motif accessibility and TF genes expression. Motif enrichment score (Z score) and CAGE expression (logTPM) are shown in the top and bottom panels, respectively, for the indicated TFs. (C) A proposed model for MET induction in fibroblast by OVOL2 and lineage factors.

