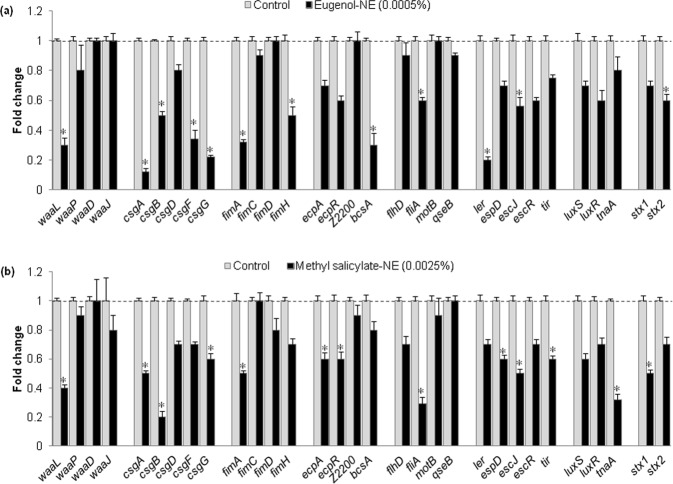
Figure 5.
Transcriptional profiles of ECOH cells treated with or without (a) eugenol-NE and (b) methyl salicylate-NE for 24 h and expression of targeted genes was quantified by qRT-PCR. Relative gene expressions represent transcriptional levels after exposure to eugenol-NE and methyl salicylate-NE versus untreated controls (value 1.0). The mixture of DW, surfactant (S; Tween 80) and co-surfactant (CS; propylene glycol) in the ration of 94.7:0.2:0.1 was used as a solvent control. The data were expressed as arithmetic mean ± SE. The experiments were carried out at least thrice in independent experiments having three replicates. *P < 0.05 versus non-treated controls.

