Fig. 3.
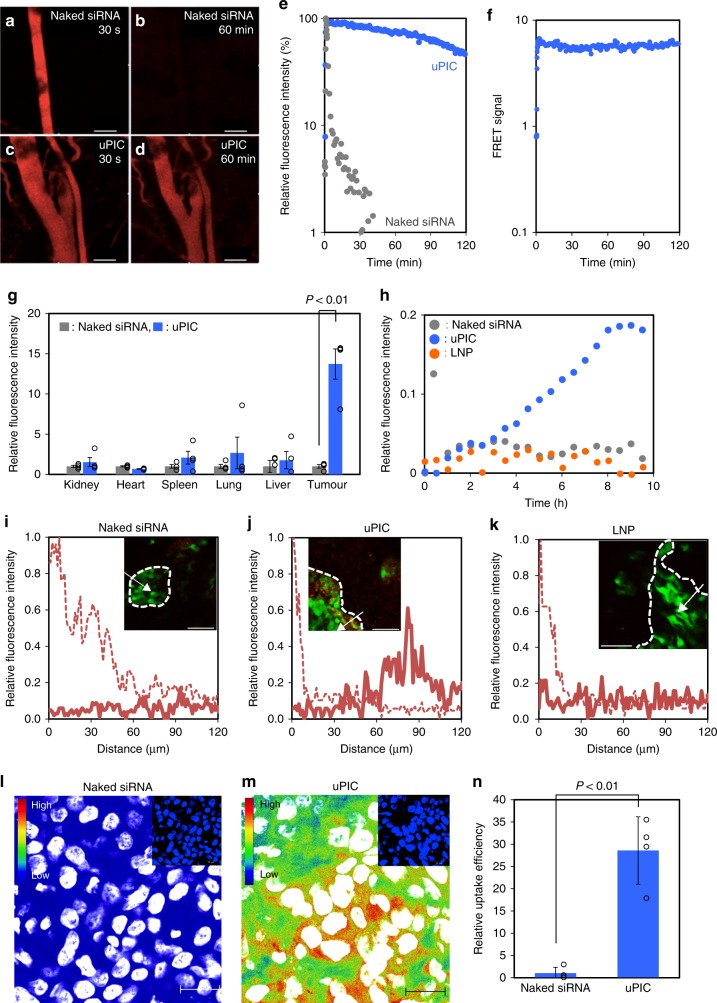
Blood circulation and tumour accumulation profiles of uPIC. a–d IVCLSM images of circulating A647-siRNA in the blood vessels of the mouse ear dermis. Naked A647-siRNA at 30 s (a) and 60 min (b) after systemic injection. A647-siRNA/uPIC (A/P = 10) at 30 s (c) and 60 min (d) after systemic injection. The scale bars indicate 100 µm. e Time-dependent change in A647 fluorescence obtained by quantitatively analysing the IVCLSM images. f Time-dependent change in the FRET signal in the vein of the mouse ear dermis after systemic injection of FRET-siRNA/uPIC. g Biodistribution of naked Cy5-siRNA and Cy5-siRNA/uPIC 48 h after systemic administration. Fluorescence intensities were normalised to those obtained from naked siRNA. Data represent the means ± s.e.m. n = 4. h Time-dependent tumour accumulation profiles of naked Cy5-siRNA, uPIC, and Invivofectamine® LNP. The fluorescence intensity was obtained from the regions of interest (ROI) in the continuous IVCLSM images (Supplementary Fig. 11a–c). i–k Spatial profiling of fluorescence intensity derived from Cy5-siRNA in tumour tissues at the initial stage (dashed line) and 10 h (solid line) after systemic administration of naked siRNA (i), uPIC (j), and LNP (k). The fluorescence intensities were measured along the direction of the white arrow in the IVCLSM image inset (red: Cy5-siRNA; green: GFP-BxPC3 cells; scale bar: 100 µm) and normalised to the maximum value obtained at the initial stage. The cancer cell nest region was identified by GFP fluorescence derived from cancer cells, as depicted by the dashed line in the IVCLSM image inset. l, m Subcellular distribution of naked Cy5-siRNA (l) or Cy5-siRNA/uPIC (m). The circular voids are cellular nuclei identified from the nuclei-stained CLSM image inset. The scale bars indicate 20 µm. n Cellular uptake efficiency of siRNA in a spheroid culture of BxPC3 cells. The cellular uptake efficiency was determined by qRT-PCR as the amount of Argonaute 2-bound siRNA (or antisense strand) and normalised to the value obtained from the cells treated with naked siRNA. Data represent the means ± s.d. n = 3

