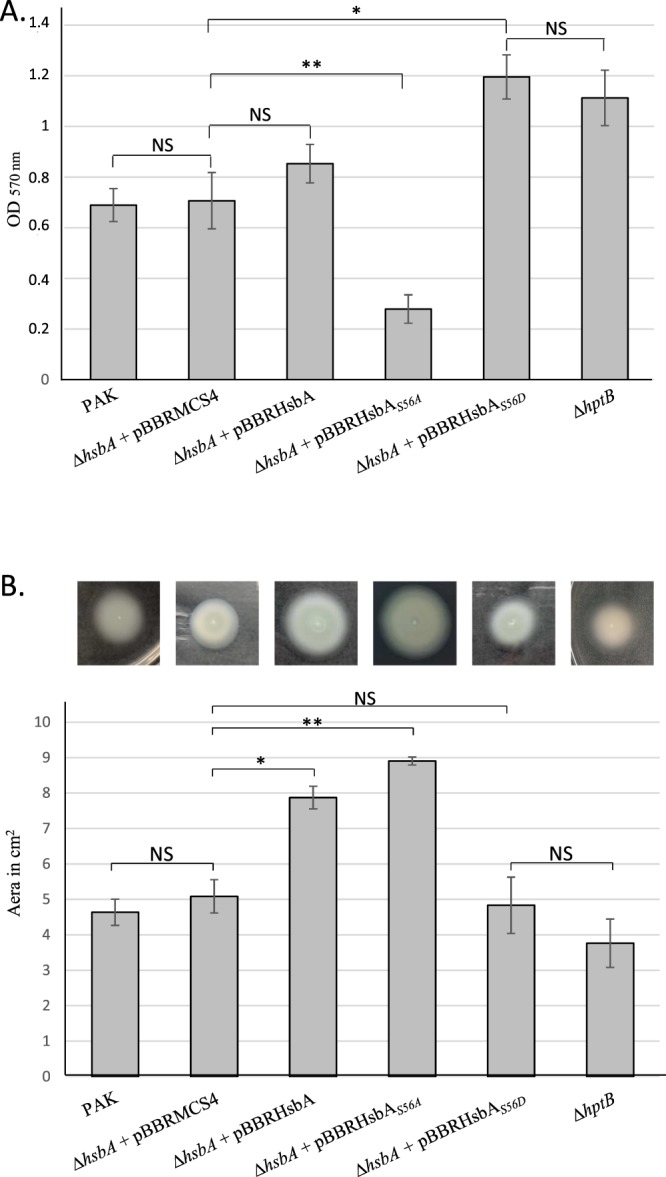
Figure 6.

Impact of HsbA variant on biofilm formation and swimming motility. (A) Quantification of biofilm production after Crystal Violet-staining. Corresponding levels of biofilm production represent mean values and standard deviations obtained from three independent experiments. (B) Swimming mobility on soft agar plate was illustrated (upper panel) and colony size surface was measured (lower panel). Colony surface is expressed in square cm and correspond to mean values and standard deviations obtained from three independent experiments. Wilcoxon-Mann-Whitney tests were performed and *, **, *** and ns referred to p < 0.05, p < 0.01 and p < 0.001 and nonsignificant difference, respectively.
