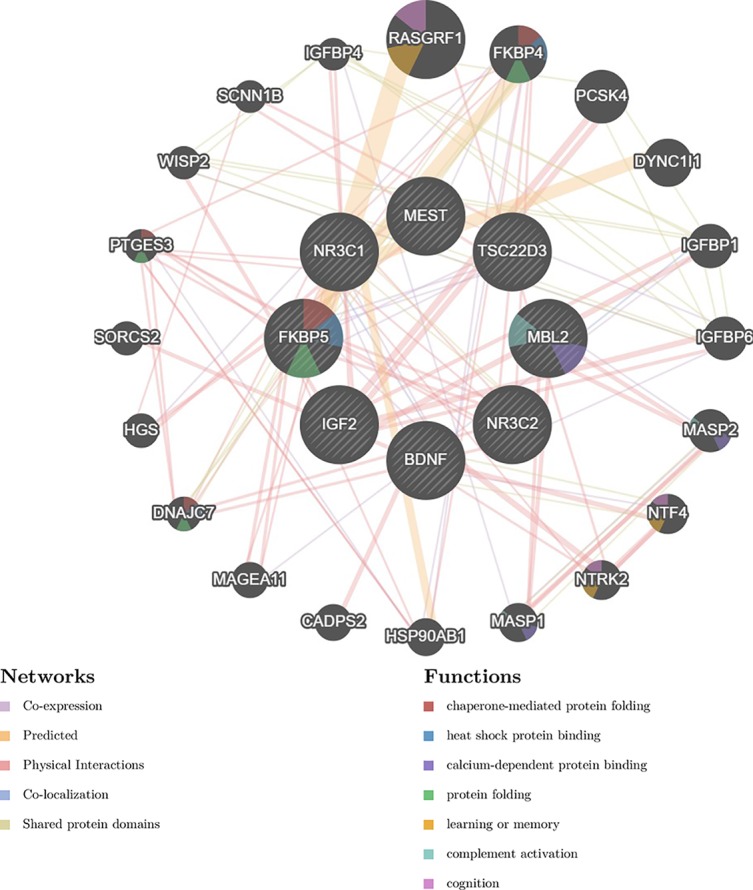
Figure 2.

Gene interaction network discussed in the current review. The network was generated by the GeneMANIA prediction server (124). The left panel presents the different types of interactions with respective color coding, depicted with lines connecting genes in the network: physical interactions (pink), predicted (orange), co-expression (purple), and shared protein domains. The right panel presents gene functions, depicted with colored slices inside the respective genes: chaperone-mediated protein folding (red), heat shock protein binding (blue), calcium dependent protein binding (dark blue), protein folding (green), learning of memory (orange), complement activation (light blue), cognition (purple).
