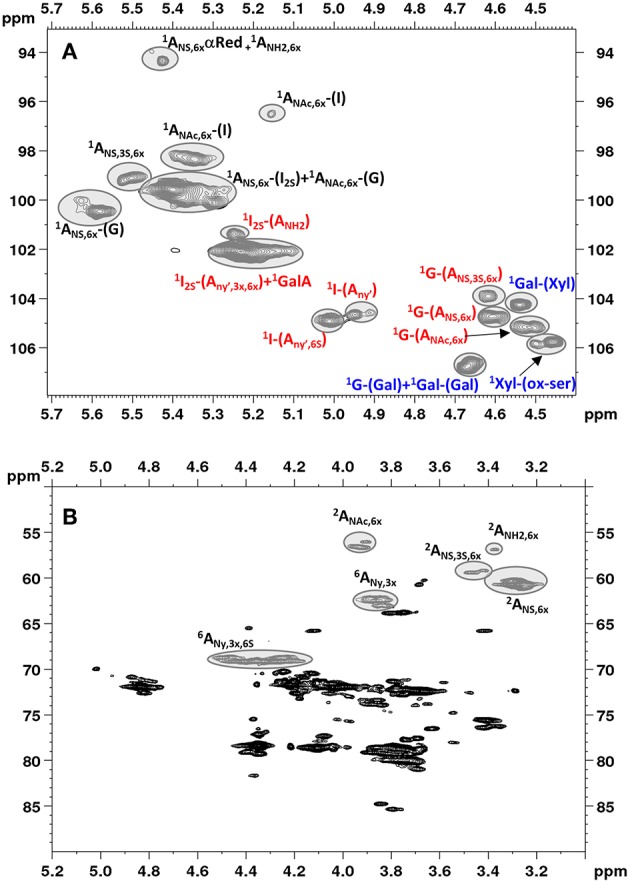
Figure 2.

Low field region showing anomeric signals (A) and high field region (B) of HSQC spectrum of Heparin batch Man_D-2 with relevant signal assignments. Ovals identify the integrated signals. Glucosamine, iduronic acid and glucuronic acid residues are indicated as A, I and G, respectively. X = H or ; Y = H or Ac or ; Y' = Ac or .
